|
Отчеты
|
https://www.oilexp.ru/oilstat/report/price-forecast-from-10-to-14-june-2024/321663/
|
Energy market:
You know, under the tsars and tsaristas, they were obliged to buy the newspaper of the Academy of Sciences, so that the Academy could make ends meet. Who would oblige us to buy our writings on the market unconditionally? At least a ruble each. Compulsory levies are not so bad, are they?
Here’s to reasonable pressure in government bond offerings! And that’s where we’re headed. Hello!
This issue was prepared with the direct participation of analysts of trading platforms eOil.ru and IDK.ru. It provides an assessment of the situation on the global and Russian market.
So, OPEC+ has passed, but there is still some residue. Despite the fact that they decided to stick to the agreement on reduction until the end of the 25th year, there is other information: quotas may be revised in September. The Arabs are itching to increase production. The reason is the same as before: to kill American shale producers. Having received such a contradictory story, the oil market is unlikely to be able to consolidate for many months above 80.00.
OPEC+ members are currently realizing production cuts totaling 5.86 million bpd, or about 5.7% of global demand. This figure includes 3.66 million bpd from OPEC+ members, an arrangement extended through the end of 2025, and 2.2 million bpd of voluntary cuts by some members, an arrangement that expires at the end of June. There’s no new information on this voluntary 2.2 million barrels yet. There is hope, but no data. And since there is, prices are going to be under pressure. There are a number of countries: Algeria, Iraq, Kazakhstan, Kuwait and the UAE, which want to produce more, having withdrawn their additional commitments on voluntary cuts.
The UAE has already been allowed to increase production by 300k barrels for the 25th year, and the rest of us don’t want to be ginger. They also want to sell more oil.
In order to overcome the differences between the firm members of the organization, OPEC countries will request information from three independent agencies that estimate production volumes. Apparently everyone there has their own ruler, it is simply impossible to measure with the same one, it is impossible to disclose all the statistics, everyone is tense and politicized and fooling each other under the veil of black muslin. Insidious. The market will continue to shake from such twists and turns.
Grain market:
Wheat fell amid reports of an excellent harvest in India, which means that the country will reduce its purchases of wheat on the foreign market. Next week we are waiting for a forecast from the U.S. Department of Agriculture, which is likely to be no less optimistic than the May forecast, which will either cause prices to fall or remain at current levels. In theory, a short-term price spike in wheat to 750 cents a bushel is possible. Assuming even higher prices in Chicago right now is not possible.
Egypt purchased wheat from France, Romania, Ukraine and Bulgaria. FOB prices amounted to $280 per ton.
Russia continues to actively ship grain, which can’t help but please domestic producers as the overhang from last year melts away. In May, 4.65 million tons of grain was exported, down 20% from the same month a year ago, but in the first 11 months of this season, 62.8 million tons were shipped, up 8% from the same period last year.
USD/RUB:
The Central Bank of the Russian Federation kept the rate at 16% per annum, but firmly and clearly promised to raise it in July. We believe.
Inflation is not slowing down, and it cannot slow down with constant emission. Money is allocated for the production of a tank that does not exist. The tank leaves the factory and after a while it ceases to be a tank, it is gone. And the extra money supply printed for that tank is now there. The drawn money, having arrived at the factory goes to purchase components, taxes and wages, that is, it appears in a significant volume to the owners, managers of enterprises and employees. And only high interest rate helps to sterilize some part of this money on the accounts, but not all of it. The majority runs to buy “Zhiguli”, who buy a car, who buy beer, raising demand for goods, which raises prices. And so on indefinitely while the SWO is going on. So we are waiting for a 20%, 25%, 30%…. 100%. Next up, Dark ages.
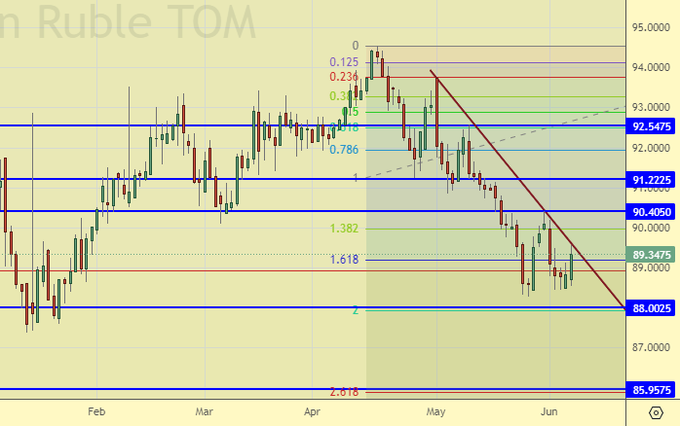
At the moment, strengthening of the ruble to 86.00 is possible. But 80.00, if it happens, is the level, at which it will be possible to buy dollars for a long time.
Brent. ICE
Let’s look at the open interest volumes for Brent. You should take into account that this is three days old data (for Tuesday of last week), and it is also the most recent data published by the ICE exchange.
At the moment there are more open long positions of asset managers than short ones. Over the past week the difference between long and short positions of asset managers decreased by 103.9 th. contracts. The reduction is ultimatum. Sellers entered the market in big volumes. Buyers risk losing control over the market.
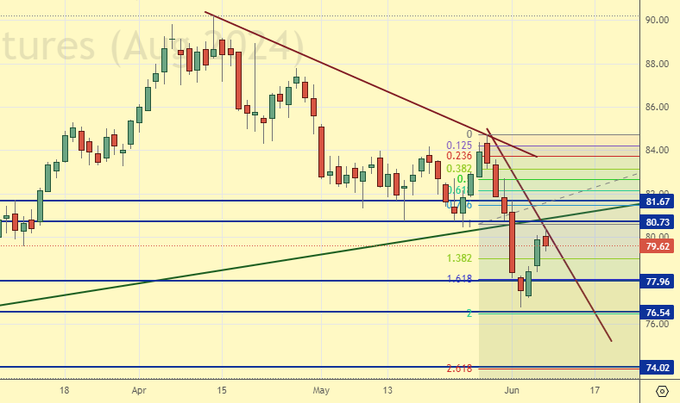
Growth scenario: we consider July futures, expiration date June 28. We don’t think about buying until we get above 84.00.
Downside scenario: it would be interesting to sell from 83.00 area.
Recommendations for the Brent oil market:
Buy: no.
Sell: when approaching 83.00. Stop: 84.20. Target: 70.00.
Support — 77.96. Resistance — 80.73.
WTI. CME Group
US fundamental data: the number of active rigs decreased by 4 units to 492.
US commercial oil inventories rose by 1.233 to 455.922 million barrels, with a forecast of -2.1 million barrels. Gasoline stocks rose 2.102 to 230.946 million barrels. Distillate stocks rose 3.197 to 122.485 million barrels. Cushing storage stocks increased by 0.854 to 35.408 million barrels.
Oil production remained unchanged at 13.1 million barrels per day. Oil imports increased by 0.289 to 7.058 million barrels per day. Oil exports rose by 0.276 to 4.501 million barrels per day. Thus, net oil imports rose by 0.013 to 2.557 million barrels per day. Oil refining increased by 1.1 to 95.4 percent.
Gasoline demand fell -0.202 to 8.946 million barrels per day. Gasoline production fell -0.527 to 9.484 million barrels per day. Gasoline imports fell -0.393 to 0.699 million barrels per day. Gasoline exports fell -0.063 to 0.891 million barrels per day.
Distillate demand fell by -0.428 to 3.367 million barrels. Distillate production rose by 0.031 to 5.061 million barrels. Distillate imports fell -0.023 to 0.142 million barrels. Distillate exports rose 0.344 to 1.38 million barrels per day.
Demand for petroleum products increased by 1.127 to 20.51 million barrels. Petroleum products production increased by 1.022 to 22.724 million barrels. Petroleum product imports fell -0.169 to 2.041 million barrels. Exports of petroleum products fell by -0.474 to 6.076 million barrels per day.
Propane demand increased by 0.234 to 0.694 million barrels. Propane production increased by 0.037 to 2.774 mln barrels. Propane imports rose 0.009 to 0.075 million barrels. Propane exports fell -0.255 to 1.792 million barrels per day.
Let’s look at the WTI open interest volumes. You should take into account that this is three-day old data (for Tuesday of last week), and it is also the most recent data published by the CME Group exchange.
At the moment there are more open long positions of asset managers than short ones. During the past week the difference between long and short positions of asset managers decreased by 50.9 th. contracts. Sellers entered the market in significant volumes. Buyers were fleeing. Bulls are keeping control.
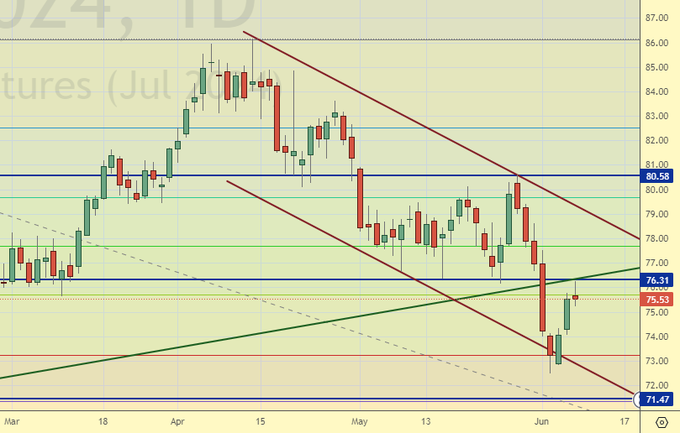
Growth scenario: we consider July futures, expiration date June 20. Now buying makes sense after growth above 80.00.
Downside scenario: selling from 78.50 will be interesting.
Recommendations for WTI crude oil:
Buy: no.
Sell: when approaching 78.50. Stop: 80.50. Target: 65.00.
Support — 71.47. Resistance — 76.31.
Gas-Oil. ICE
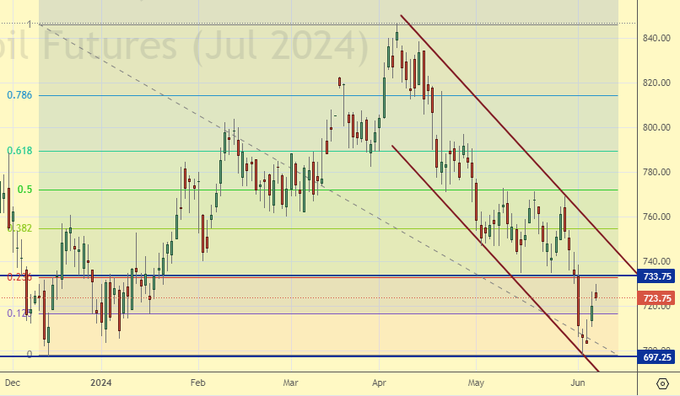
Growth scenario: we consider July futures, expiration date July 11. The growth story ended with nothing. Out of the market.
Downside scenario: there are no interesting levels for sales. Out of the market.
Gasoil Recommendations:
Buy: no.
Sale: no.
Support — 697.25. Resistance — 733.75.
Natural Gas. CME Group
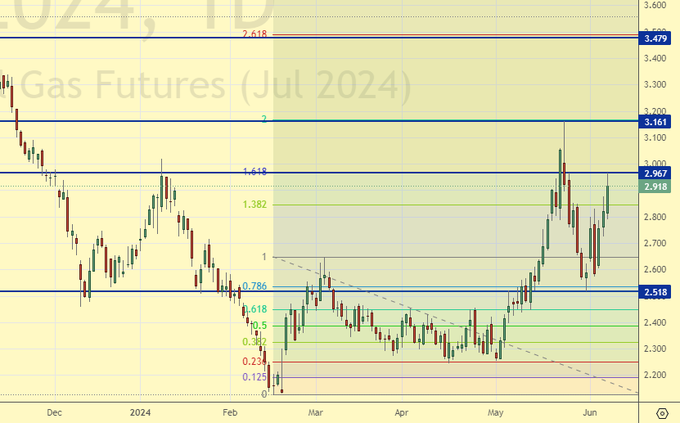
Growth scenario: we consider July futures, expiration date June 26. We hold long. The level of 3.400 is realistic.
Downside scenario: when approaching 3.500 we will think about selling. Out of the market for now.
Natural Gas Recommendations:
Buy: No. Those in position from 2.300, move your stop to 2.600. Target: 3.400.
Sale: not yet.
Support — 2.518. Resistance — 2.967.
Diesel arctic fuel, ETP eOil.ru
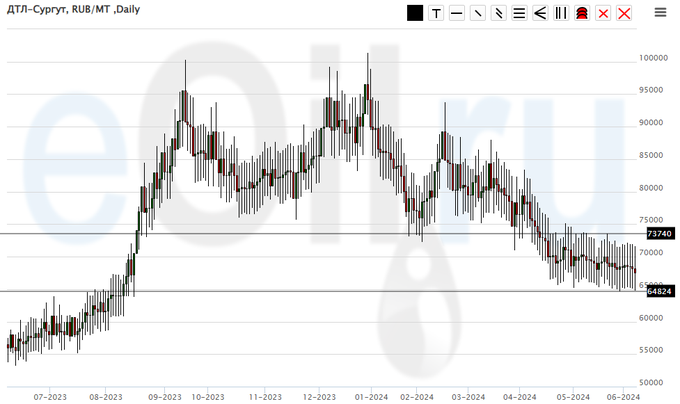
Growth scenario: until we are above 75000, we don’t think about buying. At the same time: purchases from 62000 are welcome.
Downside scenario: we won’t sell as we can’t believe there is no need for diesel right now.
Diesel Market Recommendations:
Buy: on approach to 62000. Stop: 58000. Target: 100000!
Sale: no.
Support — 64824. Resistance — 73740.
Propane butane (Surgut), ETP eOil.ru
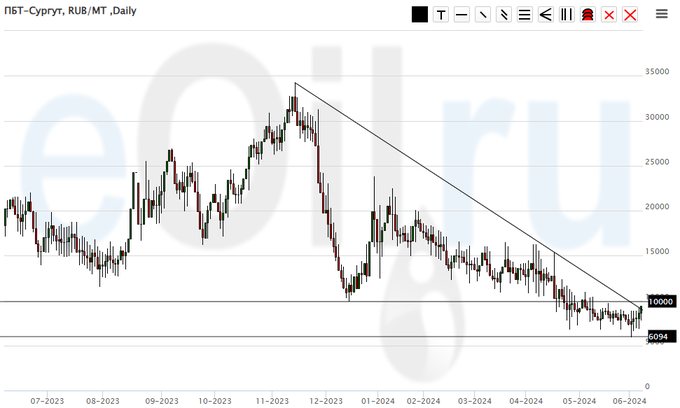
Growth scenario: we will buy, but only after growth above 11000.
Downside scenario: we stay out of the market. A move to 5000 is possible, but selling is risky now. It is better to be in commodities than in cash.
PBT Market Recommendations:
Buy: in case of growth above 11000. Stop: 8800. Target: 25000. You can be aggressive.
Sale: no.
Support — 6094. Resistance is 10000.
Helium (Orenburg), ETP eOil.ru
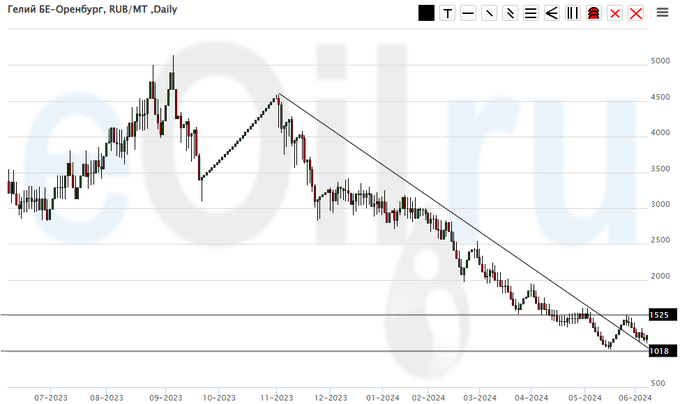
Growth scenario: we see growth from 1000. Nevertheless, still out of the market.
Downside scenario: stay out of the market, prices are low.
Helium market recommendations:
Buy: no.
Sale: no.
Support — 1018. Resistance — 1525 area.
Wheat No. 2 Soft Red. CME Group
Let’s look at the volumes of open interest in Wheat. You should take into account that this is three days old data (for Tuesday of last week), and it is also the most recent data published by CME Group.
At the moment there are more open short positions of asset managers than long ones. During the past week the difference between long and short positions of asset managers increased by 4.8 th. contracts. Speculators did not make any bets for two weeks in a row. Bears are keeping control for the time being.
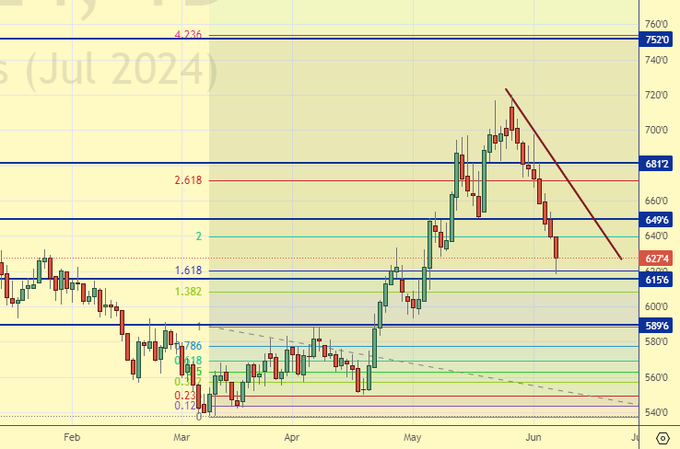
Growth scenario: we consider July futures, expiration date July 12. We see oversold. We can buy.
Downside scenario: nothing new, shorting from 750.0 would be a good decision given that the current rise has weak fundamental support.
Recommendations for the wheat market:
Buy: now (627.4). Stop: 612.0. Target: 750.0.
Sell: when approaching 750.0. Stop: 770.0 Target: 600.0.
Support — 615.6. Resistance — 649.6.
Corn No. 2 Yellow. CME Group
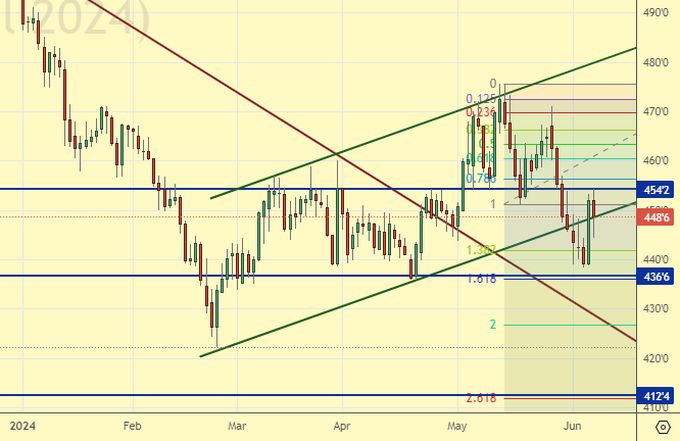
Let’s look at the volumes of open interest in Corn. You should take into account that this data is three days old (for Tuesday of last week), it is also the most recent of those published by the CME Group exchange.
At the moment there are more open short positions of asset managers than long ones. Over the past week the difference between long and short positions of asset managers increased by 87.8 thousand contracts. The change is significant. Sellers appeared on the market in large volumes. Buyers were retreating. Bears have increased their control again.
Growth scenario: we consider July futures, expiration date July 12. On the background of good expectations for the harvest, do not buy.
Downside scenario: it would be interesting to sell from 550.0. It is also possible to sell on a pullback to 460.0. This market is able to go to 360.0 on the wave of new crop volumes.
Recommendations for the corn market:
Buy: no.
Sell: on approach to 460.0. Stop: 470.0. Target: 360.0. Or when approaching 550.0. Stop: 570.0. Target: 360.0?!
Support — 436.6. Resistance — 454.2.
Soybeans No. 1. CME Group
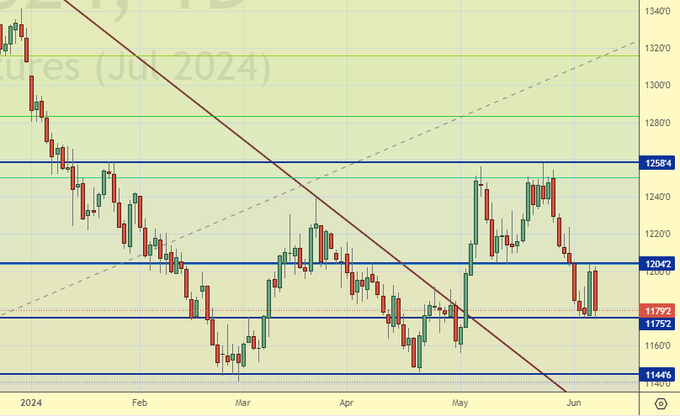
Growth scenario: we consider July futures, expiration date July 12. We got nothing on the upside. We are out of the market for now.
Downside scenario: we interpret the current picture as equilibrium. From 1310 we will definitely go short.
Recommendations for the soybean market:
Buy: no.
Sell: when approaching 1310.0. Stop: 1330.0. Target: 960.0.
Support — 1175.2. Resistance — 1204.2.
Gold. COMEX
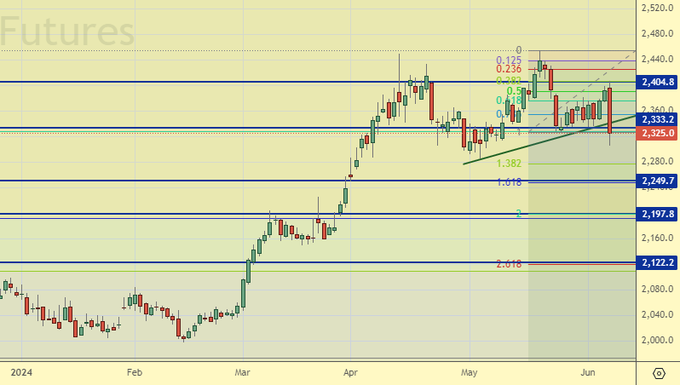
Growth scenario: we consider the August futures, expiration date August 28. For purchases we continue to want a correction. Buying from 2120 will be interesting.
Downside scenario: based on Friday’s red candle — sell.
Gold Market Recommendations:
Buy: when approaching 2120. Stop: 2070. Target: 2650?!
Sell: now (2325). Stop: 2410. Target: 2120.
Support — 2249. Resistance — 2333.
EUR/USD
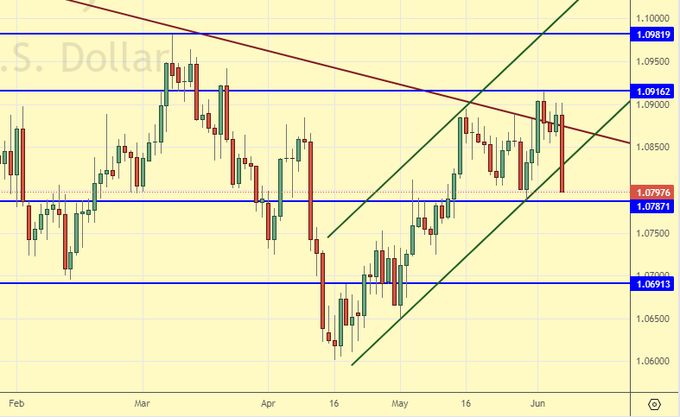
Growth scenario: bulls may reverse the situation, but until that happens we remain out of the market.
Downside scenario: the dollar has gained strength at the expense of a weak euro, but we have the Fed on the 12th, which could lead to more volatility. Off-market.
Recommendations on euro/dollar pair:
Buy: no.
Sale: no.
Support — 1.0787. Resistance — 1.0916.
USD/RUB
Growth scenario: most likely, we will enter long from 86.00. So far out of the market. The rate has not been raised, but people can play back the rate increase in July, which was announced.
Downside scenario: it is possible to try to enter short from 91.20. We remain of the opinion that as long as the Central Bank has not raised the rate above 20%, the ruble will be looked at as a quite healthy creature.
Recommendations on dollar/ruble pair:
Buy: when approaching 86.00. Stop: 85.00. Target: 95.00?!
Sell: when approaching 91.20. Stop: 91.60. Target: 86.00.
Support — 88.00. Resistance — 90.40.
RTSI. MOEX
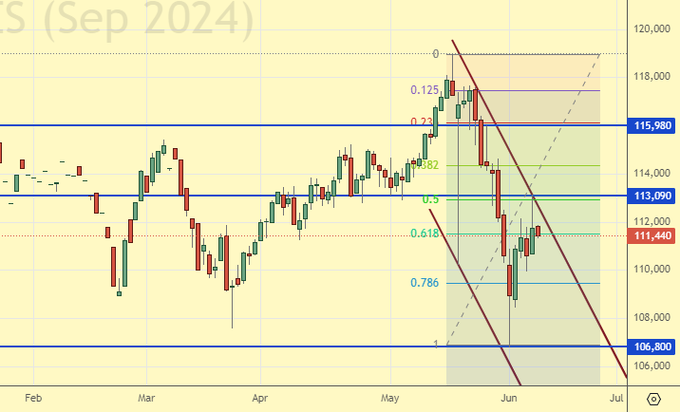
Growth scenario: we switched to September futures, expiration date September 19. We do not believe in the growth in dollars of the Russian market. We do not buy.
Downside scenario: if there will be a rise to 116000, it will be possible to sell. Current levels are undervalued.
Recommendations on the RTS index:
Buy: no.
Sell: when approaching 116000. Stop: 116800. Target: 103000.
Support — 106800. Resistance — 113090.
The recommendations in this article are NOT a direct guide for speculators and investors. All ideas and options for working on the markets presented in this material do NOT have 100% probability of execution in the future. The site does not take any responsibility for the results of deals.

