|
Отчеты
|
https://www.oilexp.ru/oilstat/report/price-forecast-from-24-to-28-of-july-2023/298058/
|
Energy market:
Year two thousand and twenty three. It’s 50 degrees in Europe. All plants died. The Rhine is running out of water. Asphalt melts, it is no longer possible to walk on it. Skyscrapers began to sag, the metal lost its strength. In Brussels, there is a smell of fried food, air conditioners are burning, and certain parts of the bodies of politicians are burning, as always, not ready for any problems. There is nothing more to drink.
From afar, the Volga River flows for a long time … Hello!
This issue has been prepared with the direct participation of analysts from eOil.ru and IDK.ru trading platforms. Here an assessment of the situation in the world and Russian markets is given.
The oil market is currently hovering around $80 per barrel. OPEC+’s efforts to balance the market are bearing fruit. However, data on US GDP will be released next Thursday. They expect +1.8% per annum for the 2nd quarter against 2.0% growth in the 1st. If GDP growth slows down to, for example, +1.4%, then this will create additional pressure on oil.
It is impossible not to say that the Chinese economy is rapidly losing export volumes: -7% in May, -12% in June. This could become a problem for all world trade. Comrades from the Middle Kingdom refer to politics, bureaucracy, duties, and the like. But, if in fact there is none of this, and the drop in shipments is just a banal evidence of a drop in global demand, then we are actually doing much worse than it seems now.
It should be noted that for about a year now the market has stopped responding to the release of data on stocks in the US. Now all minds are busy watching the clash of East and West, and now one of the hottest topics in the past does not affect price action in any way. For this, comrades from OPEC can be given a “plus”. But still, they are sorry: they will have to further reduce production.
Reading our forecasts, you could take a move up in the gas oil market from 700.0 to 800.0 dollars per ton. You could also take a move higher in the wheat market from 632.0 to 700.0 cents per bushel. You could also make money on the EUR/USD pair by taking a move up from 1.0720 to 1.1210.
Grain market:
Russia’s withdrawal from the grain deal at the beginning of the week was a major event for the grain market. Volatility in wheat and corn has become indecently high, reflecting the degree of involvement of traders in the process of monitoring the Black Sea region. Russia and Ukraine together provide 25% of all wheat supplies to the foreign market. All international wheat trade: 216 million tons.
The conflicting parties hastened to inform the world that ships in the Black Sea become a legitimate target if they are close (a loose concept) to both the Ukrainian and Russian coasts. This only adds fuel to the fire. It is possible that the Russian side will have to organize a military convoy to escort tankers with grain.
The heat in Europe, where it’s 50 degrees, mostly hits Greece, Italy and Spain. The northern regions will survive the heatstroke from the Sahara without problems. In this case, crop losses will be in the amount of 2-3%. The wheat is ripe.
USD/RUB:
Elvira Sakhipzadovna raised the rate by 1%, which came as a small surprise. The Bank’s statement refers to the desire to reduce inflation in 2024 to 4%. This is a wonderful impulse, but it will be difficult (impossible) to achieve the goal. If the current situation persists, the ruble will continue to slide down, albeit with some lunch breaks.
Over the past 12 months, receipts of dollars and euros into the country have been constantly declining, as the Central Bank itself points out. The current situation is such that almost all the receipts of reserve currencies are spent on the purchase of imports. In the bottom line, we have all sorts of “tugriks”: yuan, rupees, lira, drachmas, some kind of pearls on strings, dried bones, shells, someone’s teeth. No jokes. Here are a number of African states keenly interested in buying oil for their products of the printing industry: that is, for candy wrappers. So cryptocurrencies are no longer a bad story.
A pullback to 85.00 rubles per dollar is equivalent to a small miracle. In general, we are going to 100.00.
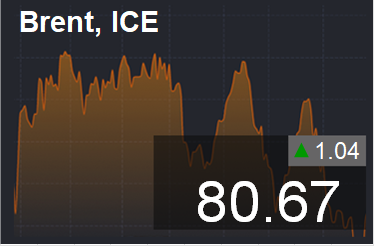
Brent. ICE
We’re looking at the volume of open interest of managers. You should keep in your mind that these are data from three days ago (for Tuesday of the past week), they are also the most recent of those published by the ICE exchange.
At the moment, there are more open long positions of asset managers than short ones. Over the past week, the difference between long and short positions of managers has decreased by 42 thousand contracts. Buyers left the market, sellers entered it. The spread between long and short positions has narrowed, the bulls continue to control the situation.
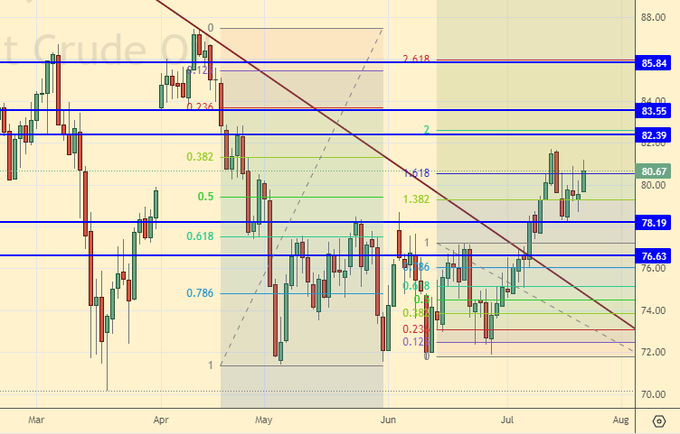
Growth scenario: we are considering the July futures, the expiration date is July 31. We continue to wait for the correction by 77.00. do not buy from current levels.
Fall scenario: we will enter short from 85.80. Short is also possible from current levels, but with an extremely close stop order.
Recommendations for the Brent oil market:
Purchase: when approaching 77.00. Stop: 76.00. Target: 91.90?!
Sale: now. Stop: 81.70. Target: 66.00. Or when approaching 85.80. Stop: 86.80. Target: 66.00.
Support — 78.19. Resistance — 82.39.
WTI. CME Group
Fundamental US data: the number of active drilling rigs fell by 7 units to 530 units.
US commercial oil inventories fell by -0.708 to 457.42 million barrels, while the forecast was -2.44 million barrels. Inventories of gasoline fell -1.066 to 218.386 million barrels. Distillate inventories rose by 0.013 to 118.194 million barrels. Inventories at Cushing fell -2.891 to 38.348 million barrels.
Oil production has not changed and stands at 12.3 million barrels per day. Oil imports rose by 1.294 to 7.174 million barrels per day. Oil exports rose by 1.67 to 3.814 million barrels per day. Thus, net oil imports fell by -0.376 to 3.36 million barrels per day. Oil refining increased by 0.6 to 94.3 percent.
Gasoline demand rose by 0.099 to 8.855 million barrels per day. Gasoline production fell by -0.584 to 9.523 million barrels per day. Gasoline imports fell by -0.062 to 0.717 million barrels per day. Gasoline exports fell by -0.043 to 1.073 million barrels per day.
Demand for distillates rose by 0.7 to 3.669 million barrels. Distillate production fell -0.054 to 5.032 million barrels. Distillate imports fell -0.008 to 0.063 million barrels. Distillate exports fell -0.004 to 0.2 mb/d.
Demand for petroleum products rose by 2.066 to 20.767 million barrels. Production of petroleum products increased by 0.117 to 22.701 million barrels. Imports of petroleum products fell by -0.003 to 1.874 million barrels. Exports of petroleum products fell by -0.472 to 6.561 million barrels per day.
Propane demand rose 0.29 to 0.916 million barrels. Propane production fell by -0.017 to 2.513 million barrels. Propane imports rose by 0.003 to 0.094 million barrels. Propane exports rose by 0.008 to 0.122 million barrels per day.
We look at the volumes of open interest on WTI. You should keep in mind that these are data from three days ago (for Tuesday of the last week), they are also the most recent of those published by the CME Group exchange.
At the moment, there are more open long positions of asset managers than short ones. Last week the difference between long and short positions of managers increased by 39.6 thousand contracts. Buyers entered the market, sellers fled in approximately the same volumes. The advantage in the market remains with the bulls.
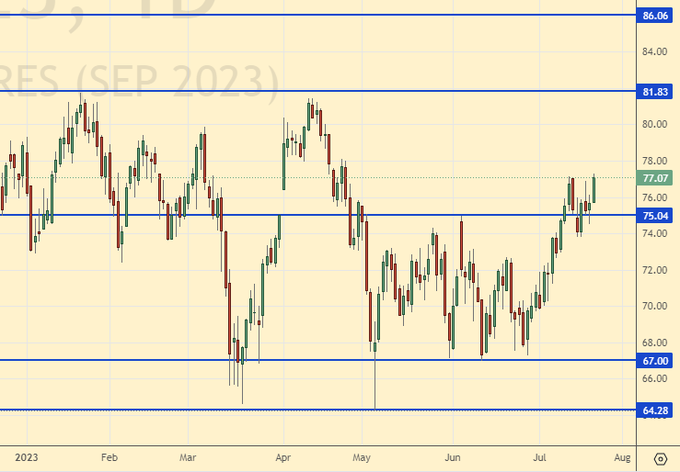
Growth scenario: consider the September futures, the expiration date is August 22. You can consider buying only when you roll back to the area of 70.00. We do not buy at current levels.
Fall scenario: For now, it makes sense to insist on selling. However, further growth could reverse the situation.
Recommendations for WTI oil:
Purchase: think when pulling back to 70.00.
Sale: now. Stop: 77.60. Target: 60.00. Who is in position from 75.00, move the stop to 77.70. Target: 60.00.
Support — 75.04. Resistance is 81.83.
Gas-Oil. ICE
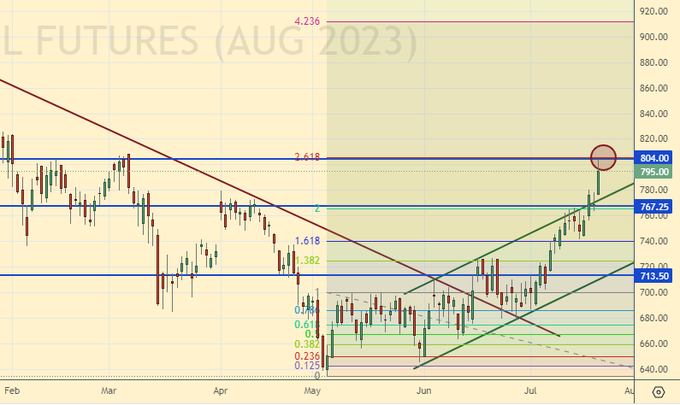
Growth scenario: consider the August futures, the expiration date is August 10. The market fulfilled our target at 800.0. Until we make purchases.
Fall scenario: we will continue to insist on sales.
Gasoil recommendations:
Purchase: no.
Sale: now. Stop: 817.0. Target: 720.0.
Support — 767.25. Resistance is 804.00.
Natural Gas. CME Group
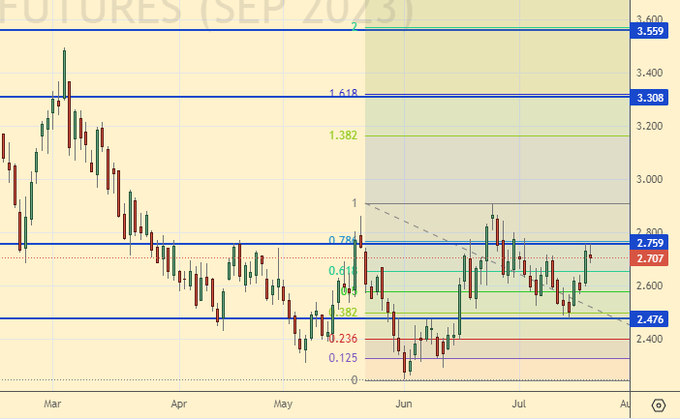
Growth scenario: we are considering the September futures, the expiration date is August 29. We will continue to stand in the longs in the expectation that the market will think about how we will pass the winter.
Fall scenario: nothing has changed for sellers. Only when approaching 4,000, you can think about entering the short.
Recommendations for natural gas:
Purchase: no. Who is in position from 2.137, 2.223 and 2.430, keep a stop at 2.400. Target: 4.000.
Sale: no.
Support — 2.476. Resistance is 2.759.
Diesel arctic fuel, ETP eOil.ru
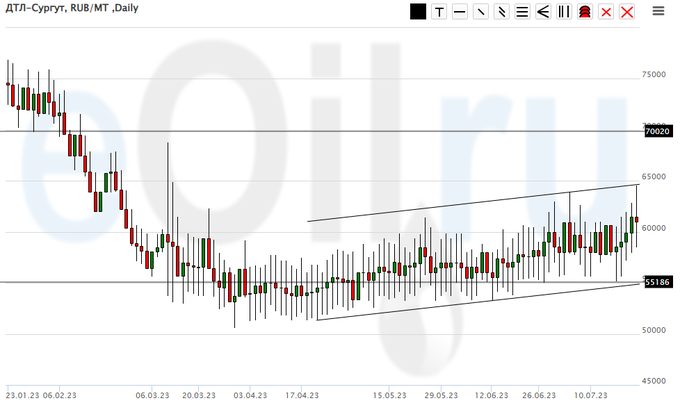
Growth scenario: we see a new maximum. Erdogan raised fuel surcharges by 200% and we cannot avoid this. Fuel will be expensive.
Fall scenario: do not sell. At the moment, there are no prerequisites for lowering fuel prices.
Diesel market recommendations:
Purchase: no. Who is in position from 55000, move the stop to 54000. Target: 70000 (80000).
Sale: no.
Support — 55186. Resistance — 70020.
Propane butane (Surgut), ETP eOil.ru
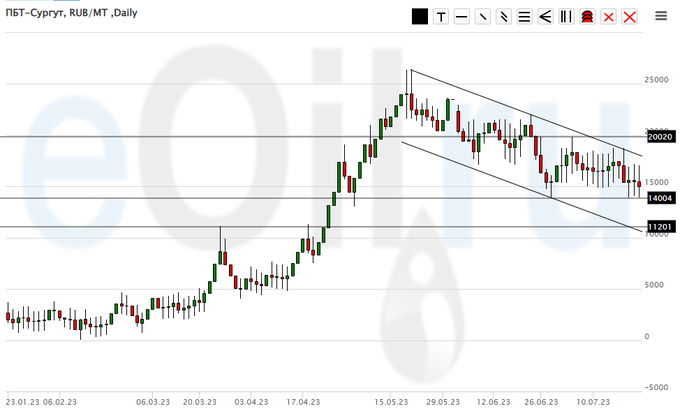
Growth scenario: the market preferred to go below 15,000, we closed on the footsteps. We do not open new purchases.
Fall scenario: despite the move below 15,000, we will not sell. We take a break.
Recommendations for the PBT market:
Purchase: no.
Sale: no.
Support — 14004. Resistance — 20020.
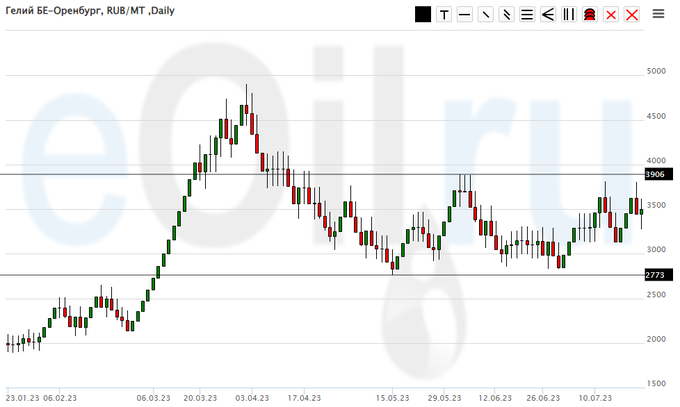
Helium (Orenburg), ETP eOil.ru
Growth scenario: while holding longs. It makes sense to move the target up to 6000. Note that the market is still in a range.
Fall scenario: Friday’s candle prevents us from opening down. We refrain from selling.
Recommendations for the helium market:
Purchase: no. If you are in position between 2900 and 3200, keep your stop at 2700. Target: 6000.
Sale: not yet.
Support — 2773. Resistance — 3906.
Wheat No. 2 Soft Red. CME Group
We’re looking at the volume of open interest of managers. You should keep in your mind that these are data from three days ago (for Tuesday of the past week), they are also the most recent of those published by the CME Group.
At the moment, there are more open short positions of asset managers than long ones. Sellers control the market. Over the past week, the difference between long and short positions of managers increased by 2.6 thousand contracts. Both buyers and sellers entered the market in extremely small volumes. The spread between short and long positions widened. Sellers hold the edge.
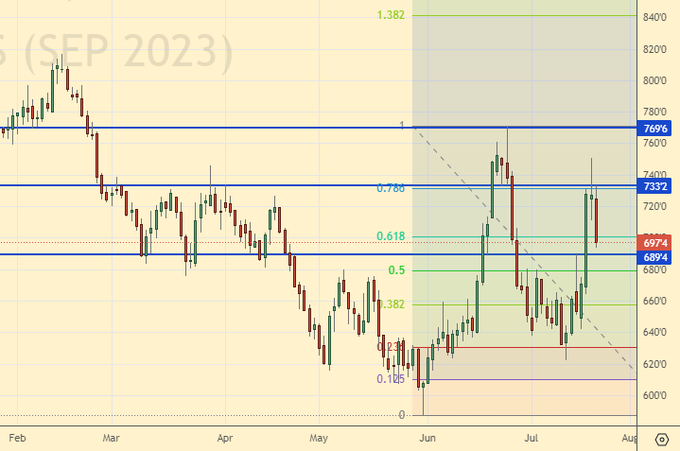
Growth scenario: consider the September futures, the expiration date is September 14th. The target at 700.0 is completed, we can leave 30% of the position and wait for the move at 880.0. The level 660.0 is interesting for a new entry.
Fall scenario: we will not sell. The consequences of the grain deal are still weighing on minds.
Recommendations for the wheat market:
Purchase: on rollback to 660.0. Stop: 635.0. Target: 880.0. Who remained in the position from 632.0 and 640.0, move the stop to 635.0. Target: 880.0.
Sale: no.
Support — 689.4. Resistance — 733.2.
Corn No. 2 Yellow. CME Group
We’re looking at the volume of open interest of managers. You should keep in your mind that these are data from three days ago (for Tuesday of the past week), they are also the most recent of those published by the CME Group.
There are more asset managers open short positions than long positions. Last week the difference between long and short positions of managers decreased by 10.0 thousand contracts. Sellers left the market, buyers remained in the end indifferent to what was happening. Sellers keep control of the market.
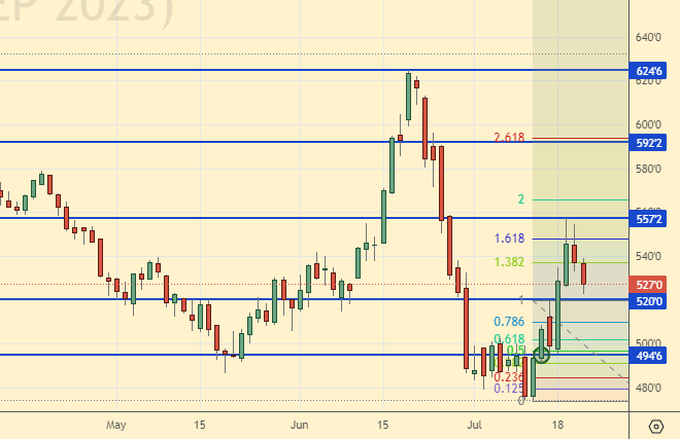
Growth scenario: consider the September futures, the expiration date is September 14th. Let’s keep going long. When approaching 500.0, you can add.
Fall scenario: while the levels for entering the short are not optimal. Out of the market.
Recommendations for the corn market:
Purchase: when approaching 500.0. Stop: 480.0. Target: 590.0. Who is in position from 490.0, move the stop to 480.0. Target: 590.0 (revised).
Sale: no.
Support — 520.0. Resistance — 557.2.
Soybeans No. 1. CME Group
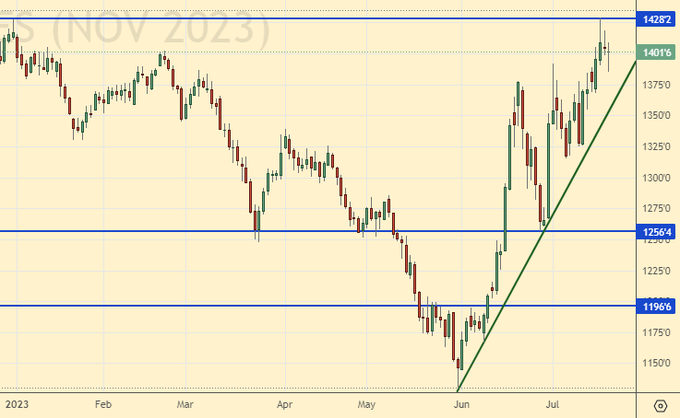
Growth scenario: we are considering the November futures, the expiration date is November 14th. We grow aggressively, but not convincingly (too long shadows at the candles). We don’t buy.
Fall scenario: we were knocked out of the short. Let’s take a break for a week.
Recommendations for the soybean market:
Purchase: no.
Sale: no.
Support — 1256.4. Resistance — 1428.2.
Gold. CME Group
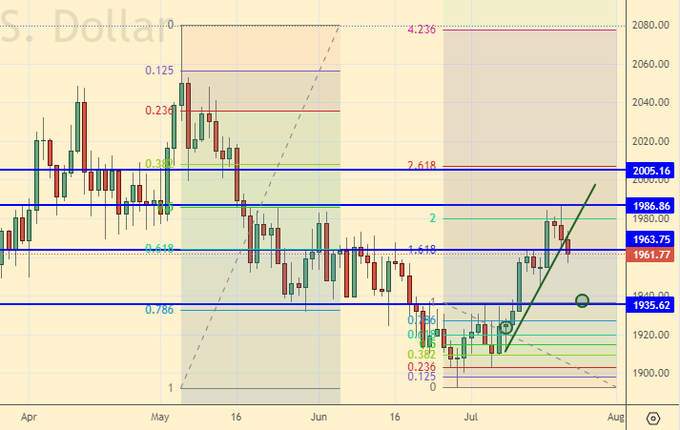
Growth scenario: as a week earlier, we believe that if there is a rollback to 1935, we can buy. The danger for gold is that the dollar may start to be in great demand among third world countries.
Fall scenario: selling is on the way, but we’ll take a week off to clear things up. The bulls may once again try to reach 2000.
Recommendations for the gold market:
Purchase: when approaching 1935. Stop: 1925. Target: 3000?!!!
Sale: no.
Support — 1935. Resistance — 1986.
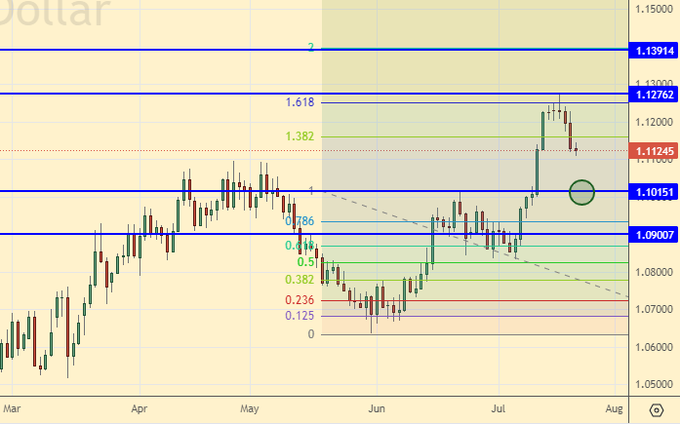
EUR/USD
Growth scenario: adjusting. You can consider buying in the range from 1.0900 to 1.1000. Next week’s Fed and ECB meetings are supposed to provide clarity for the next couple of months.
Fall scenario: you can hold the short opened a week earlier. The stop is moved below the entry point, which will ensure breakeven.
Recommendations for the EUR/USD pair:
Purchase: think in the area of 1.0900 — 1.1000. Strong volatility is possible.
Sale: no. Who is in position from 1.1245, move the stop to 1.1240. Target: 1.0960.
Support — 1.1015. Resistance is 1.1276.
USD/RUB
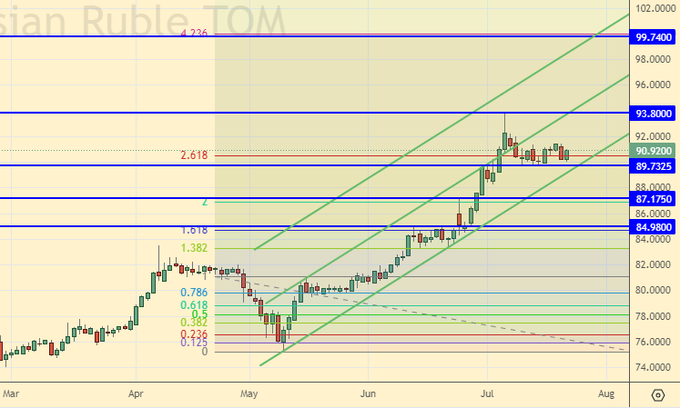
Growth scenario: bulls hold the 90.00 area. and we keep long and look at 100.00.
Fall scenario: short closed on stop. Let’s take a break this week. Note that if there is a move to 100.00, then selling from this mark is not the best option, as a rally may begin.
Recommendations for the dollar/ruble pair:
Purchase: no. Who is in position from 86.00, keep the stop at 88.80. Target: 100.00.
Sale: no.
Support — 89.73. Resistance is 93.80.
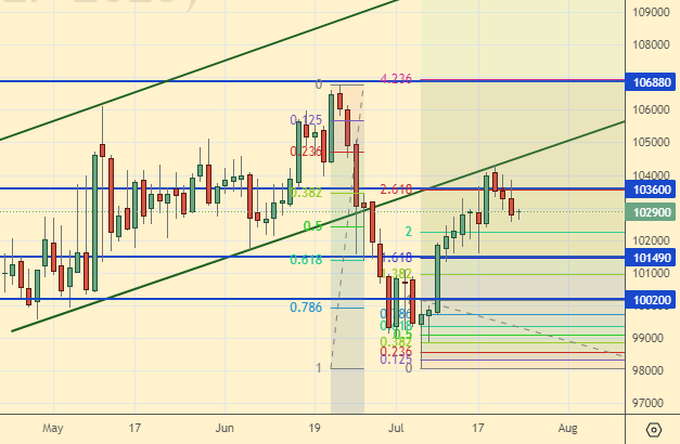
RTSI
Growth scenario: we are considering the September futures, the expiration date is September 15th. We can’t go above 105000, so we don’t think about buying. Out of the market.
Fall scenario: keep short. It is possible that the stock market will begin a downward reversal after a long stage of recovery.
Recommendations for the RTS index:
Purchase: no.
Sale: no. Who is in position between 105000 and 103000, keep stop at 106000. Target: 90000 (50000; 20000?!!!).
Support — 101490. Resistance — 106880.
The recommendations in this article are NOT a direct guide for speculators and investors. All ideas and options for working on the markets presented in this material do NOT have 100% probability of execution in the future. The site does not take any responsibility for the results of deals.
