|
Отчеты
|
https://www.oilexp.ru/oilstat/report/price-forecast-from-16-to-20-january-2023/284750/
|
Energy market:
Optimists buy shares of Russian companies, pessimists buy gold, the smartest ones buy bonds. Everyone buys something.
May you never run out of money so that you can constantly buy something. Hello!
This issue has been prepared with the direct participation of analysts from eOil.ru and IDK.ru trading platforms. Here an assessment of the situation in the world and Russian markets is given.
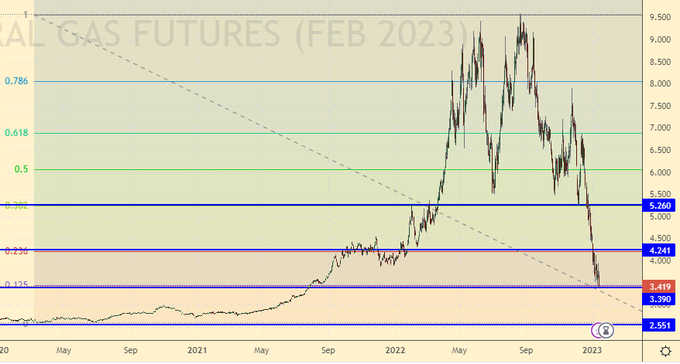
The gas market is the biggest surprise of this winter. Blue fuel prices are falling as most of Europe is, by our standards, just warm weather. Considering that almost all shipyards that can produce LNG carriers received new contracts last year, we can say that the fuel supply crisis will be resolved in 12-18 months. It may happen that Russia will not be among the energy suppliers for the EU for several years, perhaps several decades.
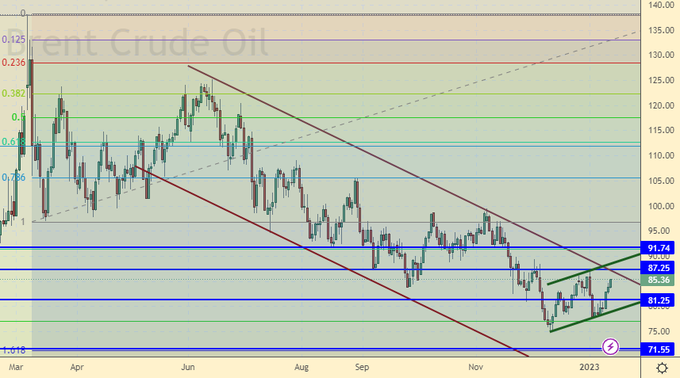
The oil market is trying to reverse the falling trend of last year. So far, this has not been successful, but the bulls are close to attracting a large number of buyers. In order for the crowd to join the purchases, they need to raise Brent oil quotes above the level of $90.00 per barrel.
Capital has flowed to Asia, with the expectation that China will again grow at 10 percent a year. Such forecasts will inevitably heat up the energy market, making bets on price growth quite attractive. However, it is worth noting that there is no panic and no uncertainty about the future. It is unlikely that oil prices will be able to go above $120 per barrel. Russian volumes, which the West voluntarily gave up, will be replaced by other market participants within a year. Europe, having a center for issuing a reserve currency, will be able to offer suppliers attractive price terms without any doubt. A shortage of fuel for a long period of time in rich Europe is simply impossible. Simply because the buyer pays in euros.
Grain market:
Another USDA report has been released. The forecast for a 0.5% fall in the gross corn harvest in the 22/23 season can be considered a small surprise, but in general, judging by the numbers, there are no problems in the sector.
Aggregate cereal production in the 22/23 season will be 2,256 million tons, down 33 million tons from the previous season. The decrease mainly reflects a smaller corn crop, which is 58 million tons lower than last year.
Despite an uncharacteristic decline in consumption for cereals, which is expected to be 1% lower than last year, and amount to 2,275 million tons, a drop in supply will lead to a further reduction in world stocks. End-of-season stocks are down 19mt to 577mt, with a stock-to-use ratio of 25.3%, the lowest since the 12/13 season.
USD/RUB:
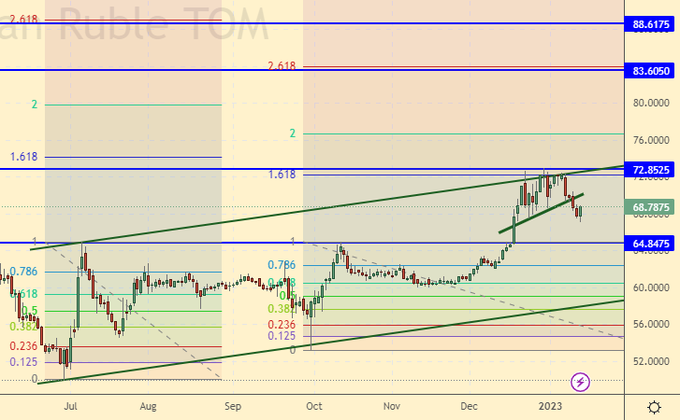
The ruble strengthened last week due to information that the exchange will sell currency from reserves to replenish the budget. The volume of currency sales is estimated at 3 billion rubles a day. At the moment, the pair has fallen by more than 4 rubles from the maximum, which was at around 72.85, to the level of 68.78.
The trading community has the right to expect the national currency to continue strengthening to the level of 65.00 rubles per dollar. We are unlikely to see a stronger strengthening. Recall that the prospects for a budget deficit this year at the level of 4% of GDP against the backdrop of sanctions and rising defense spending are more than real. In the current economic model, a strong ruble is not beneficial for the Government of the Russian Federation.
Brent. ICE
We’re looking at the volume of open interest of managers. You should keep in your mind that these are data from three days ago (for Tuesday of the past week), they are also the most recent of those published by the ICE exchange.
At the moment, there are more open long positions of asset managers than short ones. Buyers control the market. Over the past week, the difference between long and short positions of managers has decreased by 5.2 thousand contracts. Both sellers and buyers entered the market, but sellers did it more actively. The spread between long and short positions narrowed. Bulls continue to control the situation.
Growth scenario: consider the January futures, the expiration date is January 31. It is worth keeping longs open a week earlier. If the market rises above 90.00, you can increase the position.
Fall scenario: current levels are interesting for short entry. You can sell here, in case the market falls below 79.00, it makes sense to increase the position.
Recommendations for the Brent oil market:
Purchase: no. Who is in position from 79.00, move the stop to 79.20. Target: 120.00?!
Sale: now. Stop: 87.70. Target: 55.00 (45.00?!!!) dollars per barrel.
Support — 81.25. Resistance — 87.25.
WTI. CME Group
US fundamental data: the number of active drilling rigs increased by 5 units and now stands at 623 units.
Commercial oil reserves in the US increased by 18.961 to 439.607 million barrels, while the forecast was -2.243 million barrels. Inventories of gasoline rose by 4.114 to 226.776 million barrels. Distillate inventories fell -1.069 to 117.716 million barrels. Inventories at Cushing rose by 2.511 to 27.781 million barrels.
Oil production increased by 0.1 to 12.2 million barrels per day. Oil imports rose by 0.638 to 6.35 million barrels per day. Oil exports fell by -2.07 to 2.137 million barrels per day. Thus, net oil imports rose by 2.708 to 4.213 million barrels per day. Oil refining increased by 4.5 to 84.1 percent.
Gasoline demand rose by 0.044 to 7.558 million barrels per day. Gasoline production increased by 0.067 to 8.533 million barrels per day. Gasoline imports fell by -0.035 to 0.516 million barrels per day. Gasoline exports fell by -0.19 to 0.867 million bpd.
Demand for distillates rose by 1.022 to 3.821 million barrels. Distillate production increased by 0.509 to 4.544 million barrels. Distillate imports rose by 0.096 to 0.209 million barrels. Distillate exports fell -0.468 to 1.085 million bpd.
Demand for petroleum products fell by -0.563 to 17.627 million barrels. Oil products production fell by -0.726 to 18.97 million barrels. Imports of petroleum products fell by -0.117 to 1.638 million barrels. Exports of petroleum products rose by 0.256 to 6.603 million barrels per day.
Propane demand rose by 0.076 to 1.221 million barrels. Propane production increased by 0.484 to 2.383 million barrels. Propane imports rose by 0.056 to 0.175 million barrels. Propane exports rose by 0.228 to 1.637 million barrels per day.
We’re looking at the volume of open interest of WTI managers. You should keep in your mind that these are data from three days ago (for Tuesday of the past week), they are also the most recent of those published by the ICE.
At the moment, there are more open long positions of asset managers than short ones. Buyers control the market. Last week, the difference between long and short positions of managers decreased by 9.5 thousand contracts. Both buyers and sellers left the market, but buyers did so more actively. The spread between long and short positions has narrowed, but the bulls remain in control.
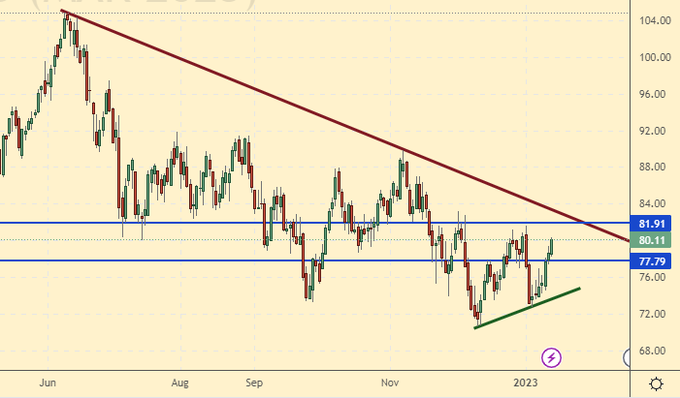
Growth scenario: switched to March futures, expiration date February 21. Quotes are growing rapidly. We continue to keep longs open a week earlier. In case of growth above 84.00, positions can be increased.
Fall scenario: the falling trend is not broken yet, the current area is interesting for sales. In case of a fall below the level of 75.00, shorts can be increased.
Recommendations for WTI oil:
Purchase: no. Who is in position from 74.00, move the stop to 74.30. Target: 110.00.
Sale: now. Stop: 81.60. Target: 66.00 (40.00). Who is in position from 86.80, move the stop to 81.60. Target: 66.00 (40.00) dollars per barrel.
Support — 77.79. Resistance is 81.91.
Gas-Oil. ICE
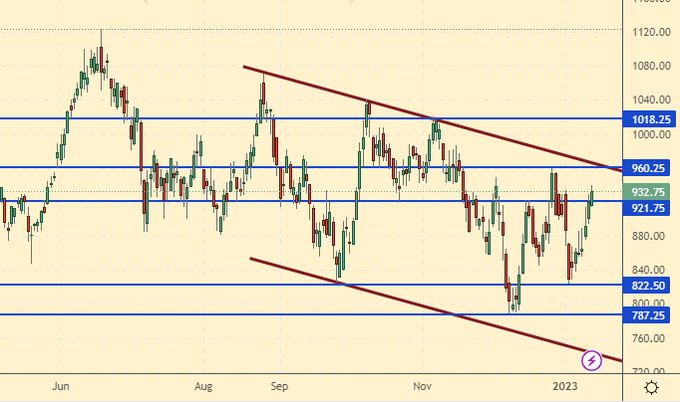
Growth scenario: we consider the February futures, the expiration date is February 10. We will continue to stop shopping. Only in case of growth above 1000.0 we will buy.
Downfall scenario: while we insist on sales. We enter short from the current levels. It can be aggressive.
Gasoil recommendations:
Purchase: no.
Sale: now. Stop: 970.0. Target: 750.0.
Support — 921.75. Resistance is 960.25.
Natural Gas. CME Group
Growth scenario: we are considering the February futures, the expiration date is January 27th. We continue to refuse to make transactions on this market. Warm winter has confused all the cards.
Fall scenario: it makes no sense to sell. Prices are low. We do not enter shorts.
Recommendations for natural gas:
Purchase: no.
Sale: no.
Support — 2.551. Resistance — 4.241.
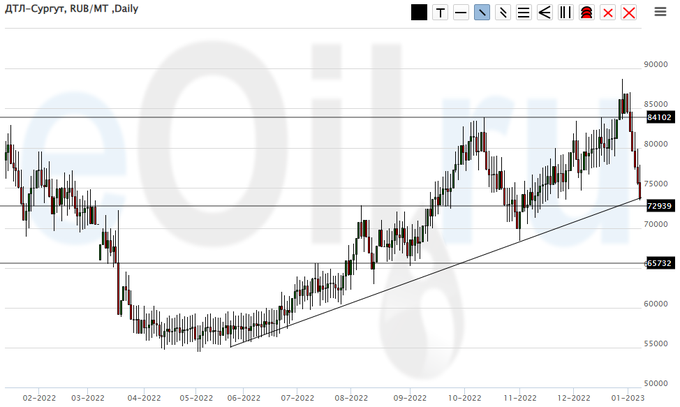
Arctic diesel fuel (Surgut), ETP eOil.ru
Growth scenario: they didn’t go up. We see that the market could not stand the prospect of an increase in supply and after the New Year prices went down. Reasonable levels for purchases are in the region of 65,000 rubles per ton. At the same time, we do not deny the move to the level of 60000.
Fall scenario: our persistence in going short for several weeks has paid off. The market is falling. A small increase from current levels is not ruled out, but it will be extremely difficult to rise above the 80,000 level.
Diesel market recommendations:
Purchase: now. Stop: 72000. Target: 79000.
Sale: no. Those who are in positions from 84,000, move the stop to 83,000. Target: 65,000 (60,000) rubles per ton.
Support — 72939. Resistance — 84102.
Propane butane (Surgut), ETP eOil
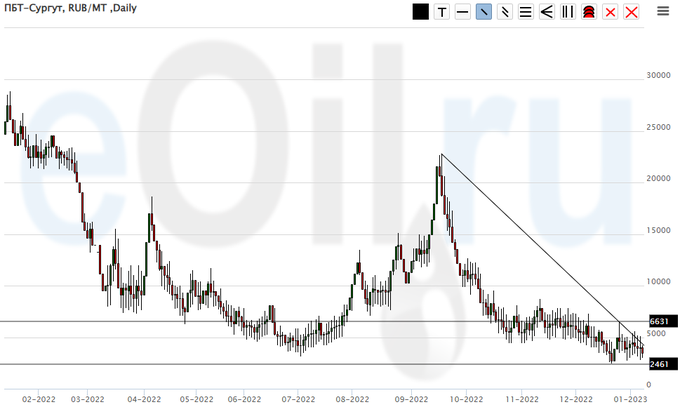
Growth scenario: prices are low. It cannot be ruled out that they will remain there for a long period of time due to the general increase in the supply of fuel in the domestic market. In case of growth above 3300, buy.
Fall scenario: we will not sell, as the market is at low levels.
Recommendations for the PBT market:
Purchase: after closing the day above 4300. Stop: 3100. Target: 8000. Whoever is in position from 4000.0, keep the stop at 2400. Target: 8000 rubles per ton.
Sale: no.
Support — 2461. Resistance — 6631.
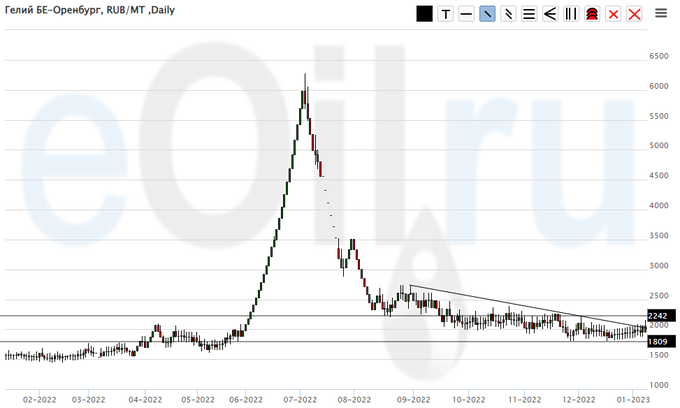
Helium (Orenburg), ETP eOil
Growth scenario: we will continue to recommend buying from current levels. We consider it possible to restore to the level of 3000.
Fall scenario: we refuse to sell. Prices are extremely low.
Recommendations for the helium market: Purchase: now. Stop: 1820. Target: 3000. Whoever is in position from 1900, keep the stop at 1820. Target: 3000 rubles per cubic meter.
Sale: no.
Support — 1809. Resistance — 2242.
Wheat No. 2 Soft Red. CME Group
We’re looking at the volume of open interest of wheat managers. You should keep in your mind that these are data from three days ago (for Tuesday of the past week), they are also the most recent of those published by the CME Group.
At the moment, there are more open short positions of asset managers than long ones. Sellers control the market. Over the past week, the difference between long and short positions of managers increased by 9.8 thousand contracts. Buyers entered the market, sellers reluctantly left it. The spread between short and long positions widened. Sellers keep the edge.
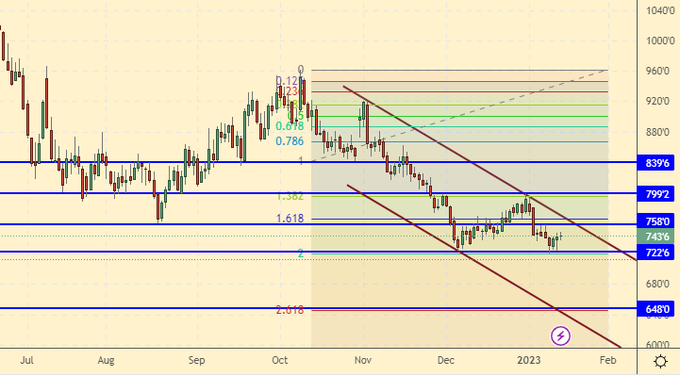
Growth scenario: we consider the March futures, the expiration date is March 14. The bulls have little chance of holding the market above the 720.0 level. Most likely we are going to go down to 650.0. We will buy either at the level of 650.0, or after rising above the level of 780.0 cents per bushel.
Fall scenario: the picture remains bearish. We hold shorts, expect a fall to the level of 650.0 cents per bushel.
Recommendations for the wheat market:
Purchase: when approaching 650.0. Stop: 630.0. Target: 800.0. Or in case of growth above 780.0. Stop: 730.0. Target: 1200.0?!!!
Sale: no. Who is in position from 750.0, keep the stop at 772.0. Target: 650.0.
Support — 722.6. Resistance is 758.0.
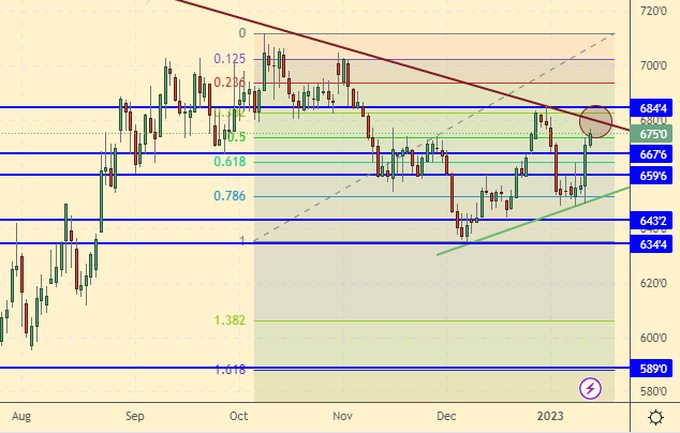
We’re looking at the volume of open interest of corn managers. You should keep in your mind that these are data from three days ago (for Tuesday of the past week), they are also the most recent of those published by the CME Group.
At the moment, there are more open long positions of asset managers than short ones. Buyers control the market. Last week the difference between long and short positions of managers decreased by 50.3 thousand contracts. The change is significant. Buyers left the market, but sellers actively entered it. The spread between long and short positions narrowed. The advantage of the bulls has noticeably shaken.
Growth scenario: we consider the March futures, the expiration date is March 14. Buying looks like a dubious enterprise in this situation. If we buy, then only after the upward breakdown of the level of 710.0. While out of the market.
Fall scenario: as long as we have not risen above the 685.0 level, sellers have a good chance of keeping the market in a downtrend. Here you can sell. A move down to 590.0 looks very likely.
Recommendations for the corn market:
Purchase: no.
Sale: now. Stop: 686.0. Target: 590.0 (550.0) cents per bushel.
Support — 667.6. Resistance — 684.4.
Soybeans No. 1. CME Group
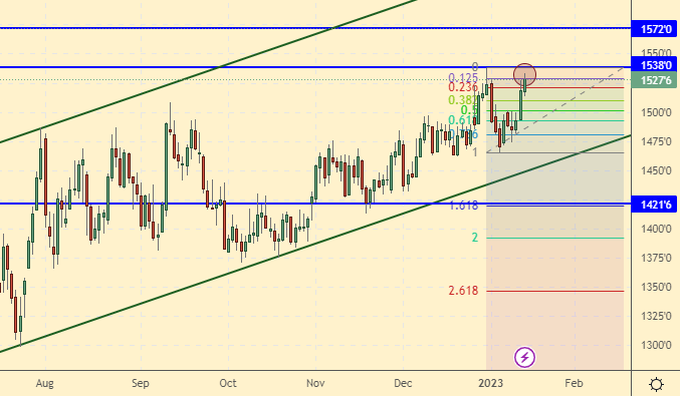
Growth scenario: we consider the March futures, the expiration date is March 14. There are big doubts about the ability to break above 1550. Let’s push the stop order to the current levels.
Fall scenario: we will continue to sell. Until the bulls convinced us of their ability to go higher.
Recommendations for the soybean market:
Purchase: no. Who is in position from 1425.0, move the stop to 1517.0. Target: 1800.0.
Sale: now. Stop: 1543.0. Target: 1000.0.
Support — 1538.0. Resistance is 1421.0.
Gold. CME Group
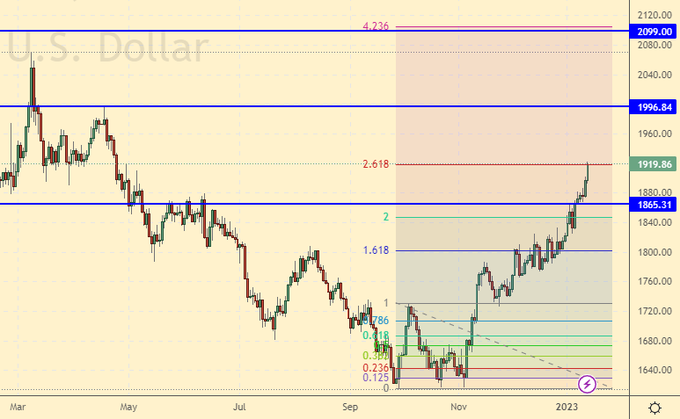
Growth scenario: 1910 target reached. Those who wish can take profits, and we are waiting for a “surprise” from the market and a rollback move to 2100, then to 2400.
Fall scenario: I really want to sell at this point. With a close stop order, this can be done.
Recommendations for the gold market:
Purchase: no. Who is in position between 1675 and 1780, move the stop to 1904. Target: 2100 (2400).
Sale: now. Stop: 1934. Target: $1,800 per troy ounce.
Support — 1865. Resistance — 1996.
EUR/USD
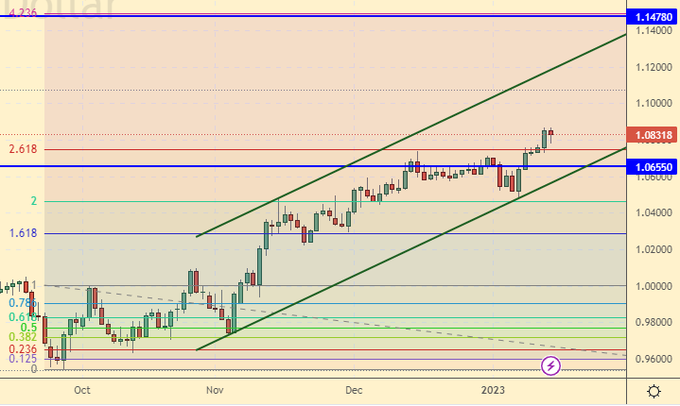
Growth scenario: we fixed above 1.0800 and went to 1.1500. On a rollback to 1.0600, it is mandatory to buy. Long from current levels is possible.
Fall scenario: like a week earlier, let’s leave the talk about entering shorts until better times.
Recommendations for the EUR/USD pair:
Purchase: now and when approaching 1.0600. Stop: 1.0570. Target: 1.1500. Count the risks.
Sale: no.
Support — 1.0655. Resistance is 1.1478.
USD/RUB
Growth scenario: from 65.00 we will definitely buy. It is possible that we will go to this mark for several days, so you should be patient. If the market returns above 73.00 without reaching the level of 65.00, you will have to buy, as there are targets at 83.00 and 85.00 rubles per dollar above.
Fall scenario: we will keep short from 72.50 to 65.60. Assuming that we will fall below 65.00 is simply naive in the current macroeconomic realities.
Recommendations for the dollar/ruble pair:
Purchase: when approaching 65.00. Stop: 63.00. Target: 83.00. In case of growth above 73.00. Stop: 71.00. Target: 83.00.
Sale: no. Who is in position from 72.50, move the stop to 72.60. Target: 65.60 rubles per dollar.
Support — 64.84. Resistance is 72.85.
RTSI
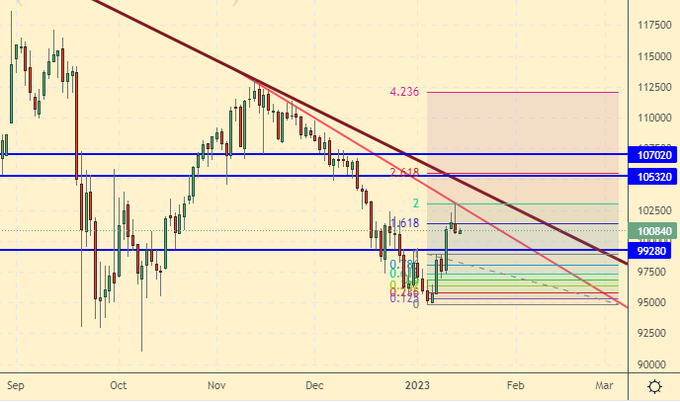
Growth scenario: we consider the March futures, the expiration date is March 16. We were unable to go above the 103000 level right away. There may be another attempt, but it will be incredibly difficult to push the market above the 105000 level. For now, we refuse to enter the long.
Fall scenario: those who wish could catch on from 101000 and go short. While the market does not look strong. We can continue to give our recommendations to sell. Note that there is no fundamental positive even on the horizon of 6 months.
Recommendations for the RTS index:
Purchase: no.
Sale: now. Stop: 103300. Target: 80000 (50000, then 20000) points. Who is in position between 106000 and 101000, move the stop to 103300. Target: 80000 (50000, then 20000) points. Also touching 105300. Stop: 107700. Target: 80000 (50000, then 20000) points. Count the risks.
Support — 99280. Resistance — 105320.
The recommendations in this article are NOT a direct guide for speculators and investors. All ideas and options for working on the markets presented in this material do NOT have 100% probability of execution in the future. The site does not take any responsibility for the results of deals.

