07 June 2021, 12:50
Price forecast from 7 to 11 June 2021
-
Energy market:
The OPEC + meeting passed without surprises. It was decided not to increase production beyond the established limits, and the topic of Iran was ignored altogether. In general, exporters are optimistic about the future, counting on an increase in oil demand in the 3rd and 4th quarters. The next meeting is scheduled for July 1.
An economic forum was held in St. Petersburg. The topic of «green» energy was touched upon by a number of participants, including representatives of the raw materials sector. Hydrocarbons were defended, but the wind fields were scolded, and no replacement of oil was seen. But states such as Britain or Japan, developing alternative energy, will not be behind the price, since this is a decrease in dependence on external factors. Let it be more expensive, but its own. This aspect should be taken into account when forecasting the balance of consumption between coal, oil, gas and alternative sources in 10-15 years.
The oil market has been growing for over a year. Fearing US inflation, Brent may go to the area of $ 75.00 per barrel at the moment, but it will be difficult to grow higher, as inflation may begin to negatively affect the ability of households to consume durable goods, which will lead to a decrease in demand for hydrocarbons.
Grain market:
The grain market is waiting for the next USDA report which will be released on June 10th. There is only one question: whether the optimism will continue or not. If forecasts for gross harvest are revised downward, this will support the market.
But there is also another side of the coin. If we assume that the United States will not cope with inflation, or will deliberately allow it, then the purchasing power of the end consumer will rapidly decline. An increase in the cost of grain by 70% may well lead to an increase in the price of a loaf of bread in the store by 150%. The same can be said about the derivatives of grain: meat, fish, poultry.
The level of spending on food in Russian families has risen to a record level over the past ten years. At the end of 2020, Russians spent 38.16% of their income on food.
Considering that the growth of inflation in 2021 is visible to the naked eye and is only officially 5.8% at the end of May, it can be assumed that the situation is unlikely to improve in the current year.
USD/RUB:
The rise in prices clearly worries Nabiullina. On Friday 11th, we have a regular meeting of the Bank of Russia, at which the rate will most likely be raised.
A calm option would be to increase the rate by 0.5%, but the head of the Central Bank may act more radically.
A number of experts are calling for a sharp increase in the rate up to one and a half percent, so that the yield on deposits lagged behind the current inflation by no more than 1%.
The problem is that the situation cannot be solved by raising the rate within the country in conditions of open markets and rising commodity prices. Developed countries should also start fighting inflation, but neither the US nor the EU is going to do this yet. It is possible that a change in the position of the largest central banks will take place in the fall.
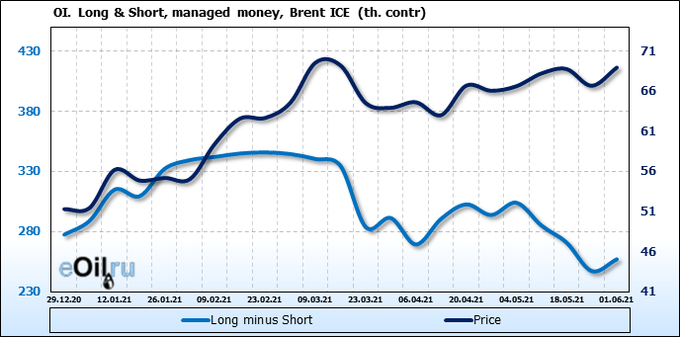
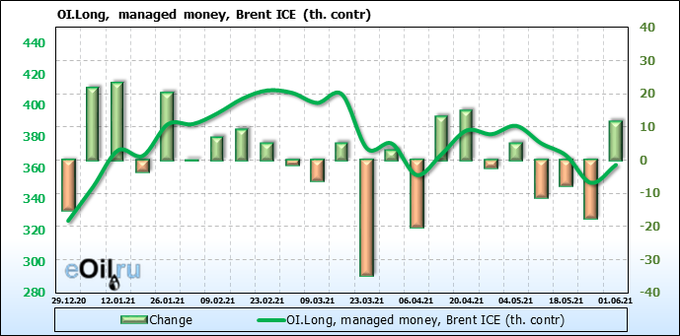
We’re looking at the volume of open interest of managers. You should keep in your mind that these are data from three days ago (for Tuesday of the past week), they are also the most recent of those published by the ICE exchange.
We see another round of interest in purchases after a competently held OPEC meeting. Nevertheless, the rollback is overdue, we expect the sellers’ activity to grow at the current levels and after the market growth to the 75.00 mark.
Growth scenario: June futures, expiration date June 30. The week was good for buyers. We are still out of the market. The prices are too high for shopping. We need a rollback to the area of 60.00.
Falling scenario: the current upward impulse may be the last. There is an option that the highs were already shown last week and the market will not go higher. We will sell now, the second chance will be at the approach to 76.00.
Recommendation:
Purchase: no.
Sale: now. Stop: 72.30. Target: 60.00. Or at touch 76.00. Stop: 77.30. Target: 60.00.
Support — 64.51. Resistance — 76.31.
WTI. CME Group
Fundamental US data: the number of active drilling rigs has not changed at 359.
US commercial oil reserves fell by -5.079 to 479.27 million barrels. Gasoline inventories rose by 1.499 to 233.98 million barrels. Distillate stocks rose 3.72 to 132.802 million barrels. Cushing’s stocks rose 0.784 to 45.539 million barrels.
Oil production fell by -0.2 to 10.8 million barrels per day. Oil imports fell by -0.642 to 5.631 million barrels per day. Oil exports fell by -0.889 to 2.544 million barrels per day. Thus, net oil imports rose by 0.247 to 3.087 million barrels per day. Refining increased by 1.7 to 88.7 percent.
Gasoline demand fell by -0.333 to 9.146 million barrels per day. Gasoline production fell by -0.182 to 9.566 million barrels per day. Gasoline imports fell by -0.101 to 0.933 million barrels per day. Gasoline exports fell by -0.173 to 0.56 million barrels per day.
Distillate demand fell by -0.648 to 3.813 million barrels. Distillate production rose 0.142 to 4.807 million barrels. Distillate imports rose 0.243 to 0.516 million barrels. Distillate exports rose 0.07 to 0.978 million barrels per day.
The demand for petroleum products fell by -0.816 to 19.14 million barrels. Production of petroleum products fell by -0.099 to 20.353 million barrels. Imports of petroleum products fell by -0.232 to 2.636 million barrels. Exports of petroleum products fell by -0.869 to 4.634 million barrels per day.
Propane demand fell by -0.027 to 1.031 million barrels. Propane production fell by -0.006 to 2.325 million barrels. Propane imports fell by -0.004 to 0.079 million barrels. Propane exports fell by -0.619 to 0.789 million barrels per day.
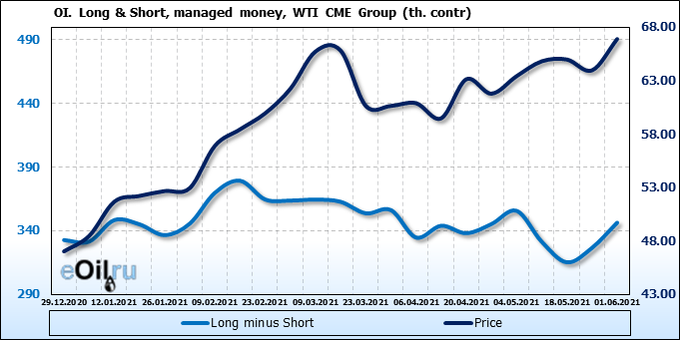
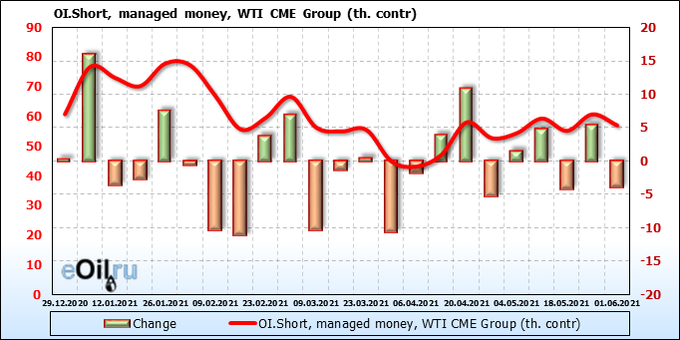
We’re looking at the volume of open interest of managers. You should keep in your mind that these are data from three days ago (for Tuesday of the past week), they are also the most recent of those published by the CME Group.
Speculators see no point in buying for the second week in a row. Sellers are also leaving the market, although the outflow is purely symbolic. The current levels are interesting for sales. The upward impulse is almost complete.
Growth scenario: July futures, expiration date June 22. We do not see any opportunities for speculation. We do not buy.
Falling scenario: we should see a rollback. With faith in the wave theory, we will fight for the short at 70.50.
Recommendation:
Purchase: no.
Sale: now. Stop: 72.20. Target: 56.00. Those who are in the position from 67.80, move the stop to 72.20. Target: 56.00.
Support — 61.75. Resistance — 70.46.
Gas-Oil. ICE
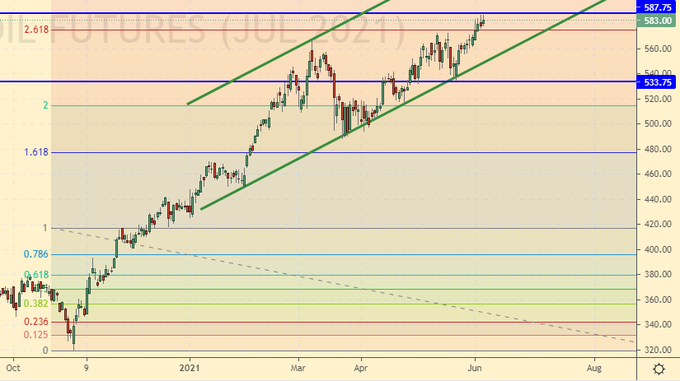
Growth scenario: July futures, expiration date is July 12th. In theory, the market can go above 600.0, but since the seasonal increase in fuel demand is already in the price, it will not be easy to do this. We will hold the previously opened long, but move the stop order closer to the current prices.
Falling scenario: sell here. Chances are not great, but the stop is nearby. Let’s check whether the upward impulse has ended or not.
Recommendation:
Purchase: no. Those who are in the position from 576.0, move the stop to 563.0. Target: 730.0 ?!
Sale: now. Stop: 597.0. Target: 480.0.
Support — 534.50. Resistance — 618.00.
Natural Gas. CME Group
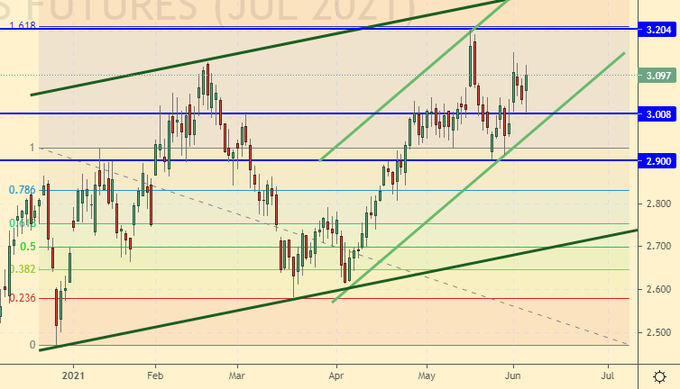
Growth scenario: July futures, expiration date June 28. We see growth. We will keep the longs opened earlier. We do not open new positions.
Falling scenario: we continue to wait for the arrival of prices to 3.500. We will think about sales there. Recommendation:
Purchase: no. Those who are in positions between 2.520 and 2.95, move the stop to 2.880. Target: 3.480.
Sale: no.
Support — 3.008. Resistance — 3.204.
Wheat No. 2 Soft Red. CME Group
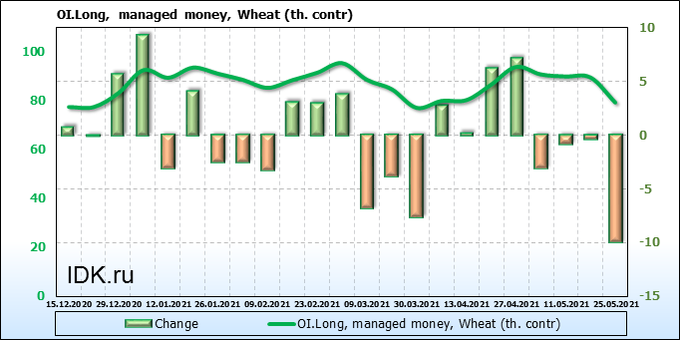
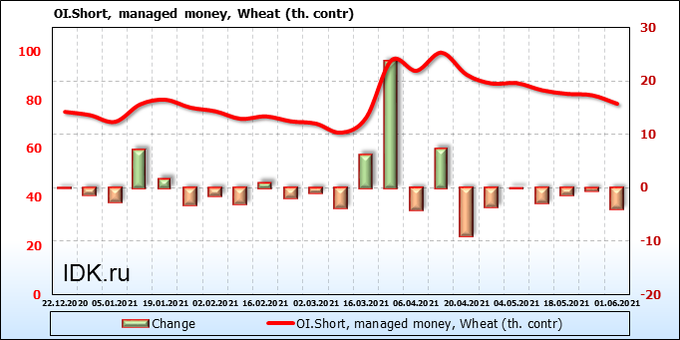
We’re looking at the volume of open interest of managers. You should keep in your mind that these are data from three days ago (for Tuesday of the past week), they are also the most recent of those published by the CME Group.
Buyers entered the week before last from 650.0, and last week no one wanted to take 700.0 each. At the same time, there are simply no sellers. The market is likely to freeze until the USDA report is released on the 10th.
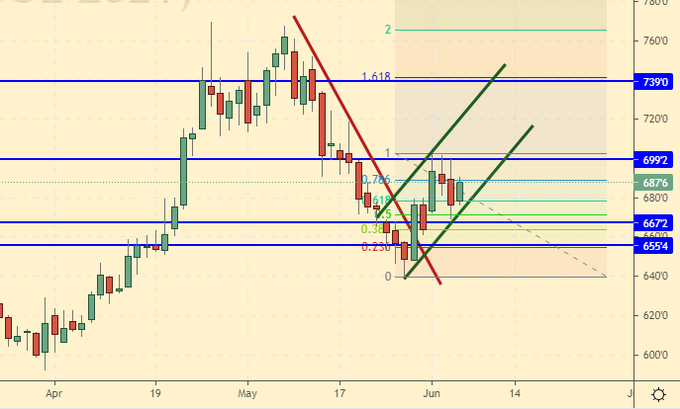
Growth scenario: July futures, expiration date July 14. If you were able to enter the market from 660.0, then you can add here. This is somewhat aggressive, but if we go up to 740.0, then the risk will be justified. We do not open new positions.
Falling scenario: let’s be extremely careful with sell recommendations. There is a possibility that the USDA will slightly lower its forecasts for gross collection due to Russia and the EU. We do not enter the short.
Recommendation:
Purchase: no. Who is in position from 660.0, you can add. Move the stop to 664.0. Target: 739.0 (revised).
Sale: no.
Support — 667.2. Resistance — 699.2.
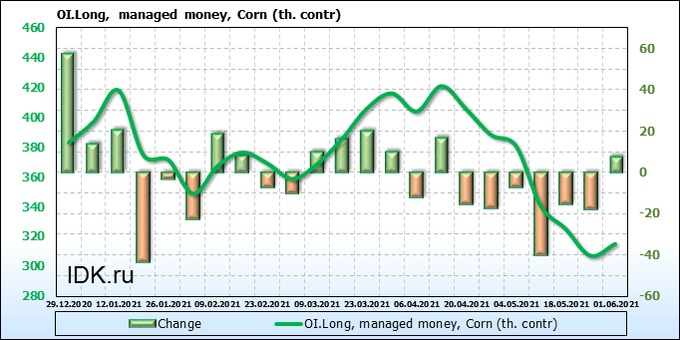
We’re looking at the volume of open interest of managers. You should keep in your mind that these are data from three days ago (for Tuesday of the past week), they are also the most recent of those published by the CME Group.
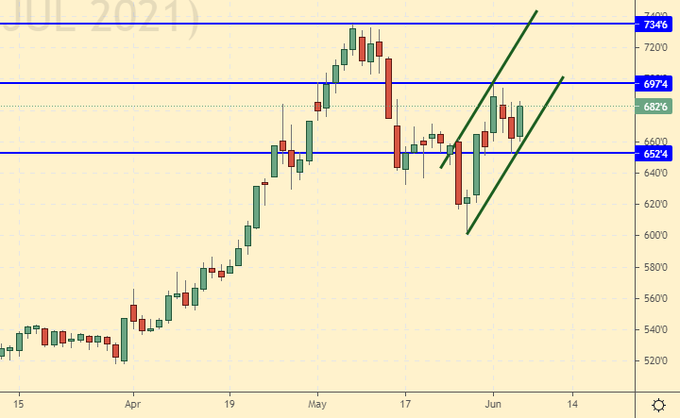
The sellers worked out the correction in the market and disappeared. We see an attempt to make the market rise again. The levels are not yet extreme when compared with 2012, when prices went down to 850.0 cents per bushel, so buyers still have psychological comfort within the previously explored area.
Growth scenario: July futures, expiration date July 14. Those who entered from 605.0 can increase their position now. 0.4 cents did not reach the profit at 697.0, but maybe this is for the best. We shift the profit up. We do not open new purchases.
Falling scenario: just like with wheat, you have to be extremely careful with shorts. Let’s refrain from selling for now. Let’s see what the USDA tells us on the 10th.
Recommendation:
Purchase: no. Who is in position from 605.0, you can add here. Move the stop to 648.0. Target: 748.0 (revised).
Sale: no.
Support — 652.4. Resistance — 697.4.
Soybeans No. 1. CME Group
Growth scenario: July futures, expiration date July 14. Last week’s purchase survived and made a profit. Let’s keep the position counting on the further growth of the market.
Falling scenario: when approaching 1710.0, you can sell. The current levels are of no interest for short entry.
Recommendation:
Purchase: no. Those who are in the position from 1520.0, move the stop to 1518.0. Target: 1704.0.
Sale: when approaching 1710.0. Stop: 1727.0. Target: 1400.0. Whoever is in the position from 1600.0, keep the stop at 1620.0. Target: 1260.0.
Support — 1486.6. Resistance — 1713.2.
Sugar 11 white, ICE
Growth scenario: July futures, expiration date June 30. We continue to believe that the market will not go above 18.50. We do not buy.
Falling scenario: sorry, but the stop at 17.90 worked. We will sell again now only when approaching 18.50.
Recommendation:
Purchase: no.
Sale: when approaching 18.50. Stop: 18.90. Target: 13.70.
Support — 17.27. Resistance — 18.56.
Сoffee С, ICE
Growth scenario: July futures, expiration date July 20. Most likely we will visit 171.0. The growth prospects are insignificant for the daily scale, so it is better to work out this scenario on 1H.
Falling scenario: it is likely that we will go to 170.0 cents per pound. When approaching this level, we will sell.
Recommendation:
Purchase: no.
Sale: when approaching 170.0. Stop: 177.0. Target: 140.0.
Support — 154.75. Resistance — 171.40.
Gold. CME Group
Growth scenario: fell to 1852, but pulled back up on Friday. Remained in a growing price channel. I would like to beautifully catch on to growth here. Let’s enter after a rise above 1910, with a target of 2000.
Falling scenario: while we are above 1850, we will not consider shorts. The dollar could rise if on Friday the data on the labor market were at least at the level of expectations, but the numbers were not encouraging. We do not sell from the current levels.
Recommendations:
Purchase: on touch 1911. Stop: 1880. Target: 2000.
Sale: on touch 2000. Stop: 2020. Target: 1890.
Support — 1852. Resistance — 1917.
EUR/USD
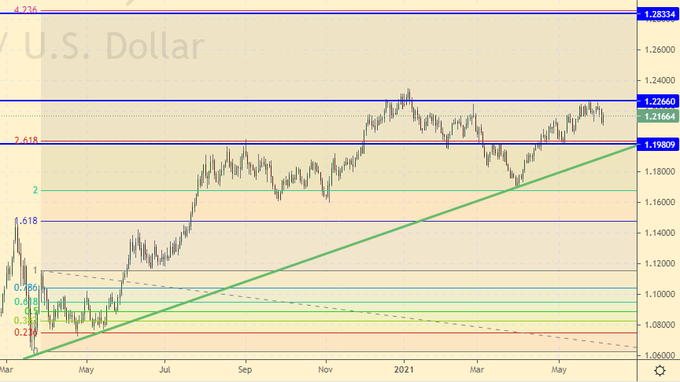
Growth scenario: the pair looked down on Thursday when initial jobless claims came out, but Friday with data on new jobs outside the agricultural sector ruined the holiday for the bears. We stand in longs.
Falling scenario: we don’t sell, but we want to. To consider selling opportunities, we need a breakdown of the support line in the 1.1950 area.
Recommendations:
Purchase: no. Whoever is in positions between 1.2050 and 1.2150, keep the stop at 1.2040. Target: 1.2800.
Sale: not yet.
Support — 1.1980. Resistance — 1.2266.
USD/RUB
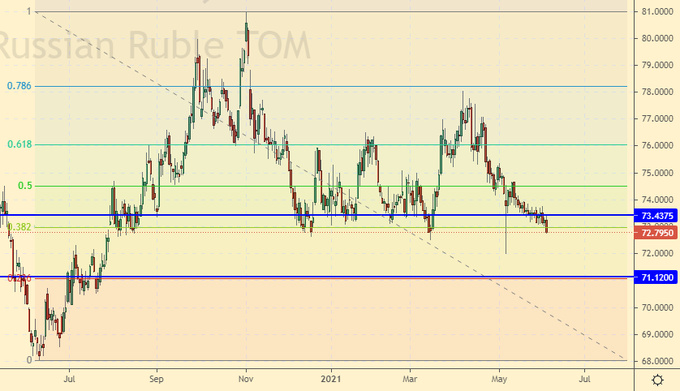
Growth scenario: amid expectations of a rate hike on Friday the 11th, the pair is likely to go down. We see that we may well go down to 71.20. We will buy exactly from the area 71.20.
Falling scenario: who went short the week before last, hold the position. The stop at 73.80 survived. 6 kopecks did not reach.
Purchase: when approaching 71.20. Stop: 70.60. Target: 80.00 ?! Consider the risks.
Sale: no. Whoever is in the position between 74.40 and 73.70, keep the stop at 73.80. Target: 71.20.
Support — 71.12. Resistance — 73.43.
RTSI
Growth scenario: global stock markets will continue to rally as traders believe the Fed will not raise rates in the coming months, focusing on a healthier labor market. Taking into account the tendency of the ruble to strengthen, we can assume that we will be able to go to 172000. We will doubt the stronger growth for now.
The level of 200,000 is visible in the distance, but in order to get there, oil must be at $ 100 per barrel, and the presidents of Russia and the United States must become best friends in the world.
Falling scenario: we did not enter the short a week earlier, and we will not do it now. The bulls are in complete control of the situation. Short is possible only when approaching the area of 170,000.
Recommendations:
Purchase: no. Anyone in the position from 155800, move the stop to 157000. Target: 171000.
Sale: on touch 171000. Stop: 173700. Target: 157000.
Support — 157350. Resistance — 172200.
The recommendations in this article are NOT a direct guide for speculators and investors. All ideas and options for working on the markets presented in this material do NOT have 100% probability of execution in the future. The site does not take any responsibility for the results of deals.


