31 May 2021, 13:31
Price forecast from 31 May to 4 June 2021
-
Energy market:
We are waiting for the OPEC + meeting on the 1 June. It will be interesting to see the reaction of the countries participating in the agreement to the continuing rise in oil prices. If we do not hear statements about increasing production, then we cannot exclude the possibility of Brent growth above $70.00 per barrel. The higher oil prices, the more projects become profitable, and this poses a serious threat to the cartel.
Given that OPEC controlled 33.8% of the market in 2017, and only 28.3% in 2020, having suffered from overproduction and the pandemic, it is likely that the current production quotas will be revised upward in order to contain the rise in prices and regain previously lost share.
It is possible that the decision to increase the volume may be postponed exactly one month in order to wait for the signing of a nuclear deal between the United States and Iran.
Tehran, after the lifting of US sanctions, may start bidding with the cartel to increase production. Perhaps you may have to make concessions.
May 31st is the Memorial Day in the United States. Trading will be sluggish. The week will start indistinctly.
By reading our forecasts, you could have made money in the wheat market by moving down from 765.0 to 652.0 cents per bushel. And also in the corn market, taking a move down from 730.0 to 605.0 cents per bushel.
Grain market:
Global grain production in the 21/22 season is expected to grow 72 million tonnes to 2,292 million tonnes.
Increased consumption of wheat and maize will increase global consumption by 59 million tonnes to 2,297 million tonnes. The remainder of cereals will be reduced for the fifth year in a row and will amount to 595 million tons.
The grain market made a correction tidily after a protracted growth stage. The market is now shifting to the USDA data release in early June.
It cannot be ruled out that the forecast for the gross yield of wheat will be slightly adjusted downward, since the Ministry of Agriculture of the Russian Federation did not share the rosy American forecasts and believes that Russia will harvest 5 million tons less wheat than the United States anticipated. In this case, the market will receive support and we will not see a further fall in prices this summer.
USD/RUB:
Biden’s $ 2 trillion plan dollars includes the creation of 19 million new jobs in infrastructure projects with a bias towards green energy. This includes the construction of wind farms in the ocean zone, the construction of a network of filling stations for electric vehicles, as well as the installation of a system for the accumulation and redistribution of electricity in every house.
If the US manages to maintain GDP growth at 6% for the next three years, the issue of money in the 20s and 21s can be considered justified.
We are waiting for the release of data in the US on the labor market. If the number of new jobs created outside the agricultural sector continues to grow, this could support the dollar. Otherwise, the ruble will have a chance to strengthen to 71.00.
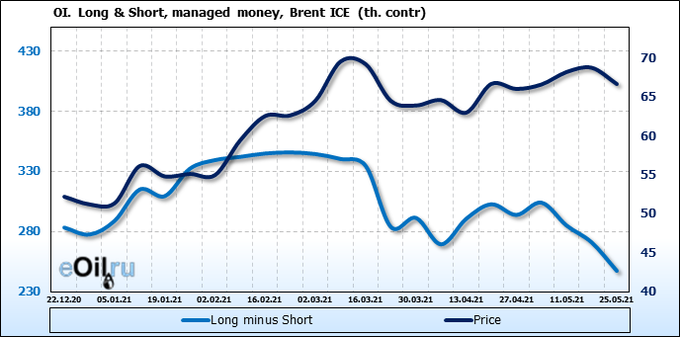
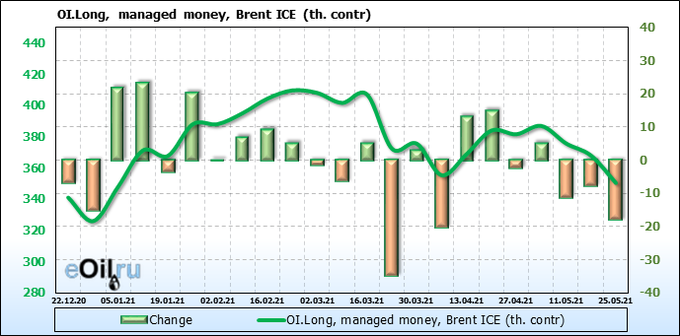
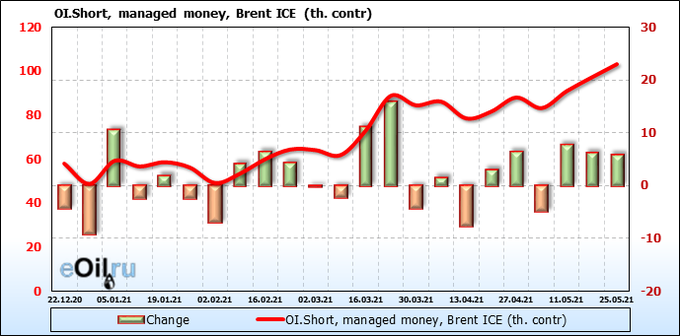
We’re looking at the volume of open interest of managers. You should keep in your mind that these are data from three days ago (for Tuesday of the past week), they are also the most recent of those published by the ICE exchange.
Sellers come to the market for three weeks in a row, while buyers disappear. Speculators are clearly betting on the fall of the market. It is possible that the big players have begun to recruit large positions in short positions, and if this is the case, they will not give up their plans without a fight.
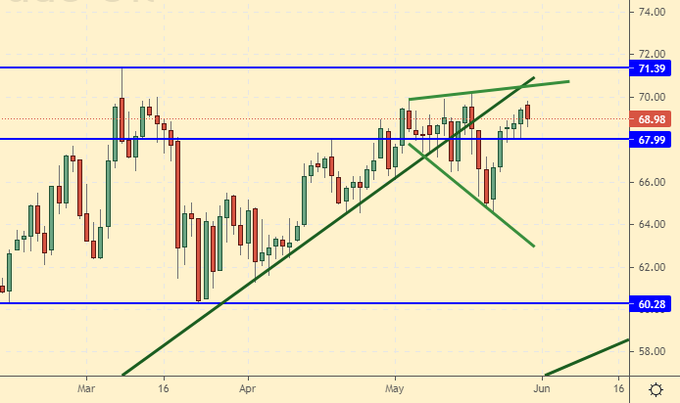
Growth scenario: June futures, expiration date June 30. There is no correction. We do not enter the long. A possible subsequent rise by a couple of dollars is of no interest.
Falling scenario: you can’t give up here. You need to look for sales opportunities. If the market falls below 67.80, we will go short again.
Recommendation:
Purchase: no.
Sale: after falling below 67.80. Stop: 69.20. Target: 53.00.
Support — 67.99. Resistance — 71.39.
WTI. CME Group
Fundamental data from the USA: the number of active drilling rigs increased by 3 to 359.
US commercial oil reserves fell -1.662 to 484.349 million barrels. Gasoline inventories fell -1.745 to 232.481 million barrels. Distillate stocks fell by -3.013 to 129.082 million barrels. Cushing’s stocks fell -1.008 to 44.755 million barrels.
Oil production has not changed at 11 million barrels per day. Oil imports fell by -0.138 to 6.273 million barrels per day. Oil exports rose by 0.127 to 3.433 million barrels per day. Thus, net oil imports fell by -0.265 to 2.84 million barrels per day. Oil refining increased by 0.7 to 87 percent.
Gasoline demand rose 0.255 to 9.479 million barrels per day. Gasoline production fell by -0.005 to 9.748 million barrels per day. Gasoline imports fell by -0.047 to 1.034 million barrels per day. Gasoline exports fell by -0.1 to 0.733 million barrels per day.
Distillate demand rose 0.403 to 4.461 million barrels. Distillate production rose 0.112 to 4.665 million barrels. Distillate imports rose 0.006 to 0.273 million barrels. Distillate exports fell by -0.186 to 0.908 million barrels per day.
The demand for petroleum products increased by 0.684 to 19.956 million barrels. Production of petroleum products increased by 0.205 to 20.452 million barrels. Imports of petroleum products increased by 0.035 to 2.868 million barrels. Exports of petroleum products rose 0.096 to 5.503 million barrels per day.
Propane demand rose 0.008 to 1.058 million barrels. Propane production rose 0.016 to 2.331 million barrels. Propane imports fell by -0.004 to 0.083 million barrels. Propane exports rose 0.116 to 1.408 million barrels per day.
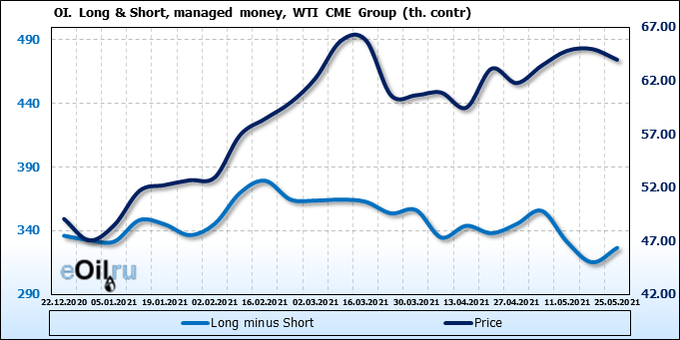
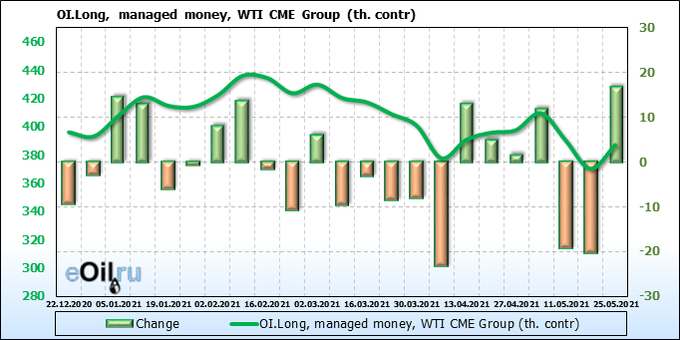
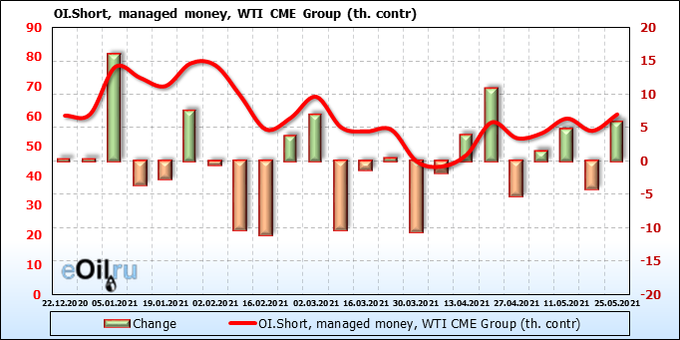
We’re looking at the volume of open interest of managers. You should keep in your mind that these are data from three days ago (for Tuesday of the past week), they are also the most recent of those published by the CME Group.
There are buyers. It is unlikely that they will dominate the market for a long time. Strong resistance levels are on the way. As sellers grow, they are likely to increase their activity.
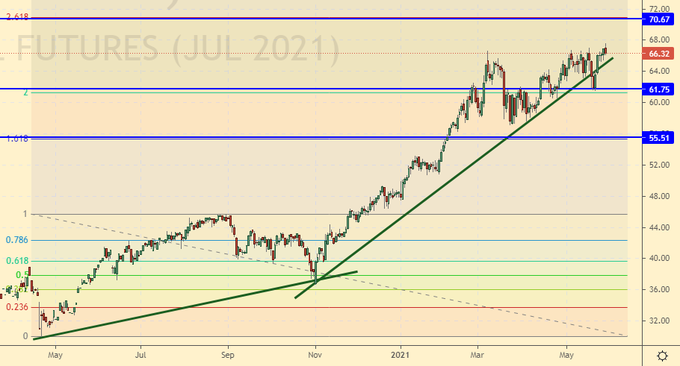
Growth scenario: July futures, expiration date June 22. It is possible that we will see a passage to 70.60, but after it a fall will begin, as the upward impulse will be completed. We do not buy.
Falling scenario: continue to fight for the short. The market has been growing for a year now and has reached pre-pandemic levels. Rollback is here. We sell both now and when approaching 70.50. Recommendation:
Purchase: no.
Sale: now and when approaching 70.50. Stop: 73.20. Target: 46.00. Consider the risks!
Support — 61.75. Resistance — 70.67.
Gas-Oil. ICE
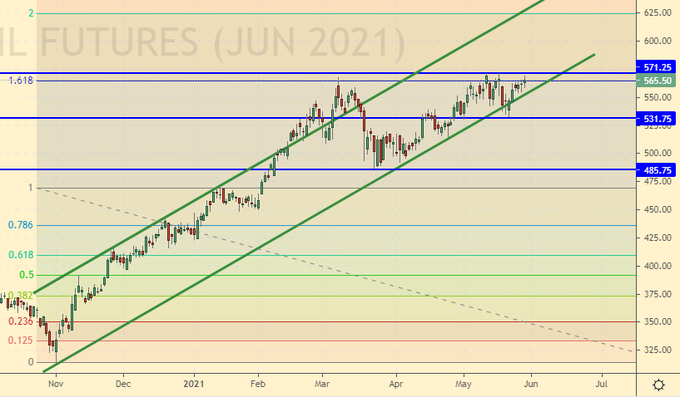
Growth scenario: June futures, expiration date June 10th. In theory, the market is able to go above 570.0 and go to 625.0. In case of movement above 575.0, you can buy.
Falling scenario: in case of another fall below 550.0, we will sell.
Recommendation:
Purchase: after rising above 575.0. Stop: 553.0. Target: 624.0.
Sale: after falling below 550.0. Stop: 562.0. Target: 440.0.
Support — 531.75. Resistance — 571.25.
Natural Gas. CME Group
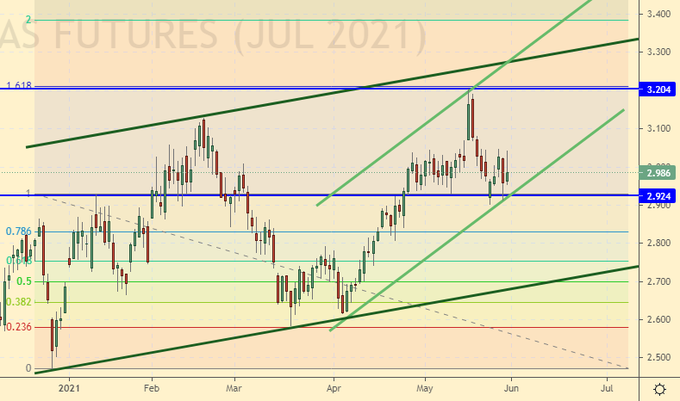
Growth scenario: July futures, expiration date June 28. The current levels are already interesting for purchases. If there is a drop to 2.800, then there can be added.
Falling scenario: do nothing. We are waiting for the arrival of prices to 3.500. We will think about sales there. Europe is behind schedule on gas injection into storage facilities. There will be demand. Prices won’t fall.
Recommendation:
Purchase: now and when approaching 2.800. Stop: 2.700. Target: 3.480. Anyone in the position from 2.520, keep the stop at 2.700. Target: 3.480.
Sale: no.
Support — 2.924. Resistance — 3.204.
Wheat No. 2 Soft Red. CME Group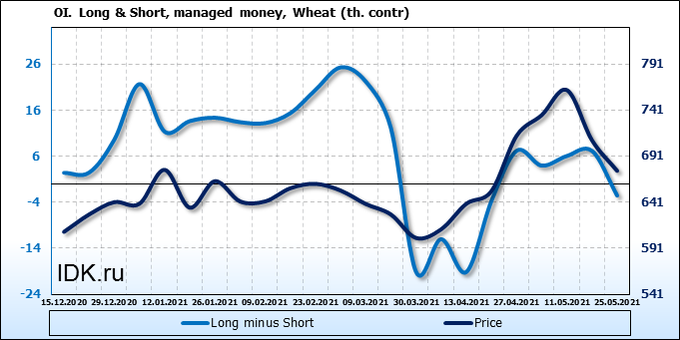
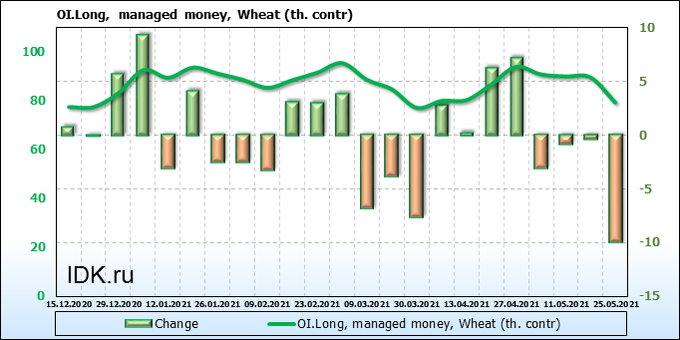
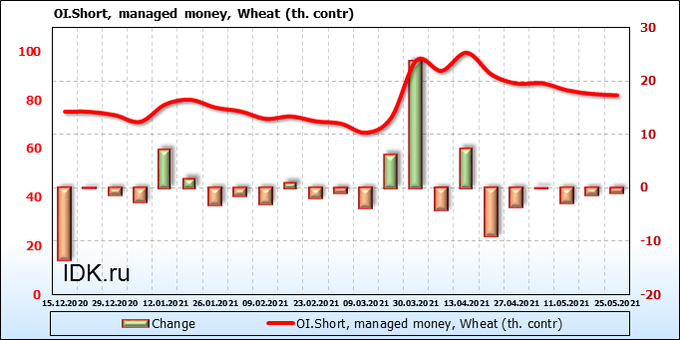
We’re looking at the volume of open interest of managers. You should keep in your mind that these are data from three days ago (for Tuesday of the past week), they are also the most recent of those published by the CME Group.
Buyers have clearly returned to the market. We do not see this in the financial statements yet, but the long green candlestick on Thursday tells us that the bulls are coming to the market. Against the background of equilibrium between supply and demand, speculators will increase their purchases at current levels or slightly below.
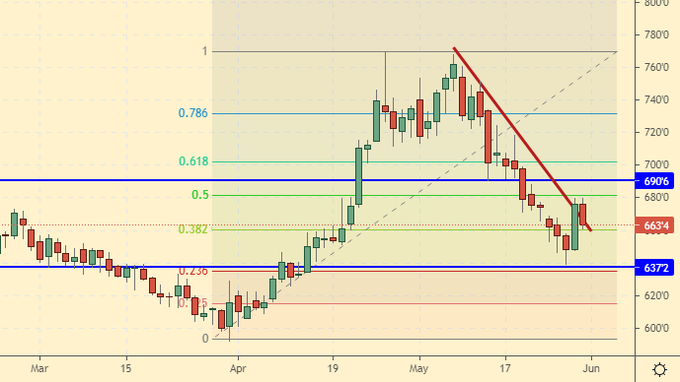
Growth scenario: July futures, expiration date July 14. If you are knocked out of the purchase, you need to log in again. There is a prospect of growth to 720.0 in the coming week.
Fall Scenario: everything we wanted happened! All with a profit. We do not open new short positions yet. Recommendation:
Purchase: now. Stop: 642.0. Target: 718.0. Consider the risks!
Sale: no.
Support — 637.2. Resistance — 690.6.
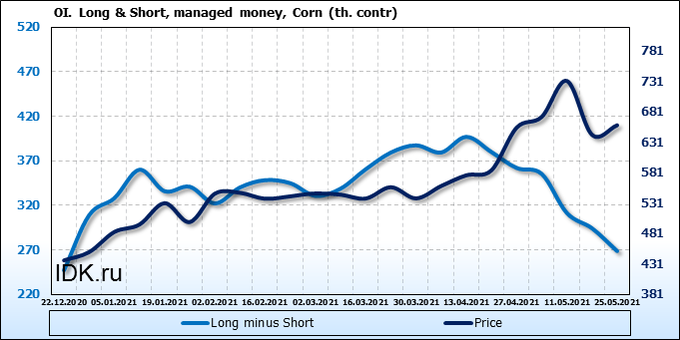
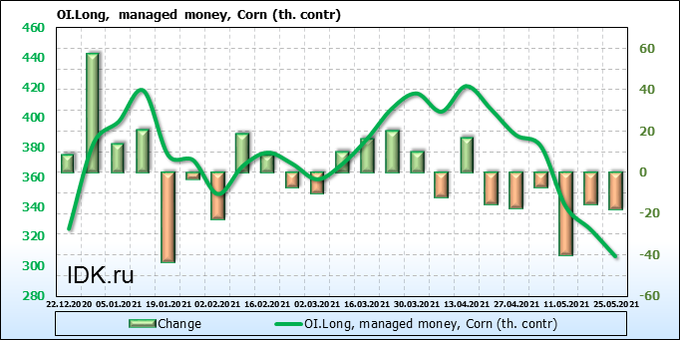
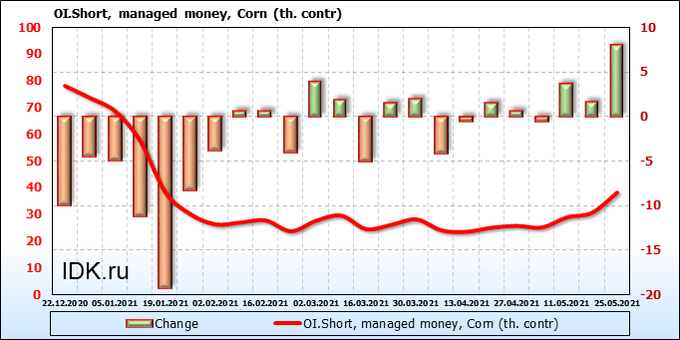
We’re looking at the volume of open interest of managers. You should keep in your mind that these are data from three days ago (for Tuesday of the past week), they are also the most recent of those published by the CME Group.
The sellers were consistently building up the pressure, due to which the market collapsed. We are now entering a gray area of uncertainty where trading will become more difficult.
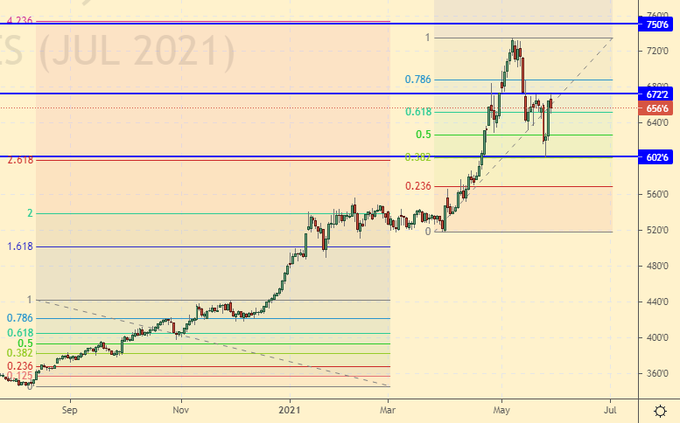
Growth scenario: July futures, expiration date July 14. If you are hooked on a long from 605.0, then stop. A return to 700.0 is possible.
Falling scenario: everything we need we got. All with a profit. We do not open new sell positions yet. Recommendation:
Purchase: no. Those who are in the position from 605.0, move the stop to 634.0. Target: 697.0.
Sale: no. All with a profit.
Support — 602.6. Resistance — 672.2.
Soybeans No. 1. CME Group
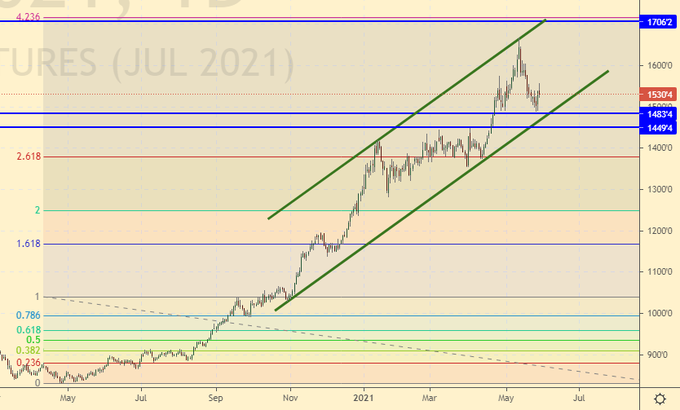
Growth scenario: July futures, expiration date July 14. Will there be another call to 1706.0, that is the question? We will buy here, but we do not have high hopes for success.
Falling scenario: if optimism about the growth of soybean production volumes, according to the USDA by 6.22%, continues to prevail in the market, then we may expect a further fall in prices. Therefore, we keep the previously opened shorts.
Recommendation:
Purchase: now. Stop: 1477.0. Target: 1704.0.
Sale: no. Those who are in the position from 1600.0, move the stop to 1620.0. Target: 1260.0.
Support — 1483.4. Resistance — 1706.2.
Sugar 11 white, ICE
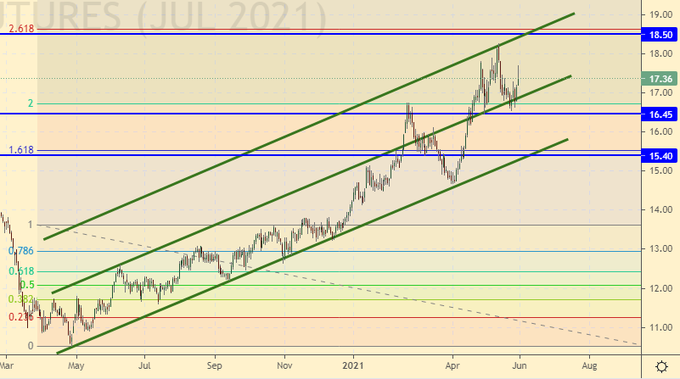
Growth scenario: July futures, expiration date June 30. It cannot be denied that a hit at 18.50 is possible, but there is nothing interesting in this for speculation, and the market is not yet visible above. We do not buy. Falling scenario: we stand in a short from 17.50, we expect to pass to 13.70 on the horizon for two to three weeks.
Recommendation:
Purchase: think when approaching 13.70.
Sale: now. Stop: 17.90. Target: 13.70. Whoever is in the position between 17.80 and 17.50, keep the stop at 17.90. Target: 13.70. When approaching 18.50, sell again. Stop: 19.50. Target: 13.70.
Support — 16.45. Resistance — 18.50.
Сoffee С, ICE
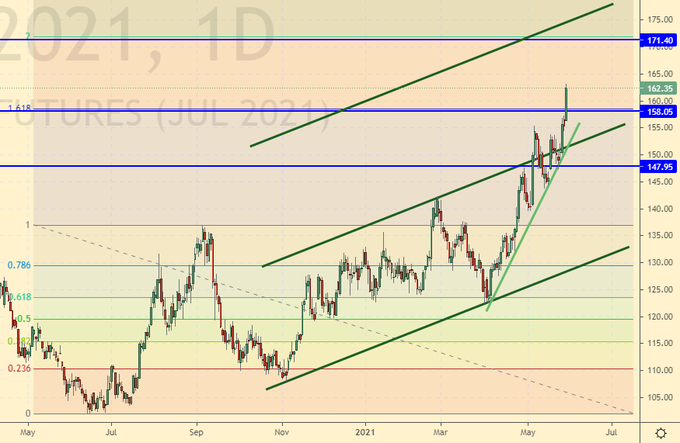
Growth scenario: July futures, expiration date July 20. The market did not stop at 158.0, which came as an unpleasant surprise. We do not buy. Late.
Falling scenario: it is likely that we will now get to 170.0. We do not sell and hold previously opened positions.
Recommendation:
Purchase: think when approaching 136.00.
Sale: no. Whoever is in the position from 158.0, keep the stop at 164.0. Target: 136.0.
Support — 158.05. Resistance — 171.40.
Gold. CME Group
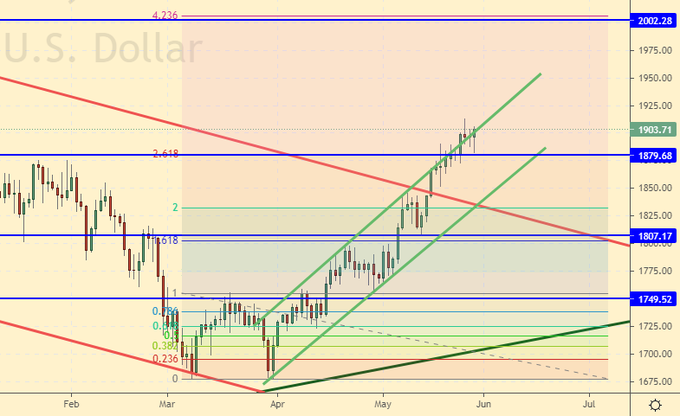
Growth scenario: we don’t want to go down. We will buy from the current levels, but place a stop order close. Target: 2000.
Falling scenario: for now, forget about the shorts. The market sees no reason to strengthen the dollar. An uptrend develops according to an aggressive scenario. Recommendations:
Purchase: now. Stop: 1874. Target: 2000. Or when touching 1810. Stop: 1780. Target: 2000.
Sale: on touch 2000. Stop: 2020. Target: 1890.
Support — 1879. Resistance — 2002.
EUR/USD
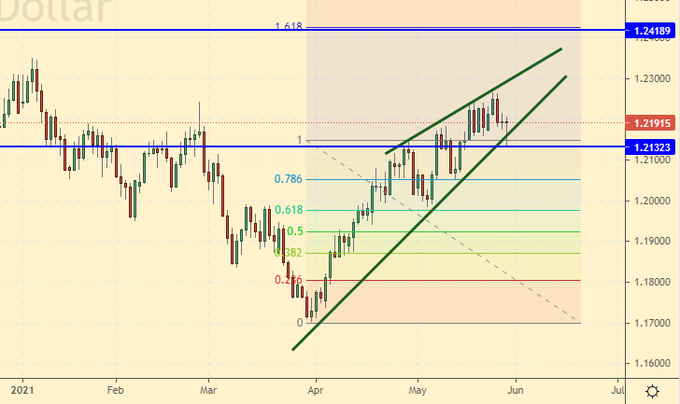
Growth scenario: we see that the dollar has no chance yet. The Friday candlestick clearly shows us that buyers are ready to push the pair to 1.2420. Only a strong labor market will help the dollar, and there is still uncertainty here. You can build up a long. We do not discard the passage to 1.2800.
Falling scenario: don’t sell yet. Only a drop below 1.2000 will make us look down.
Recommendations:
Purchase: now. Stop: 1.2120. Target: 1.2800. Those who are in the position from 1.2050, move the stop to 1.2040. Target: 1.2800.
Sale: no.
Support — 1.2132. Resistance — 1.2418.
USD/RUB
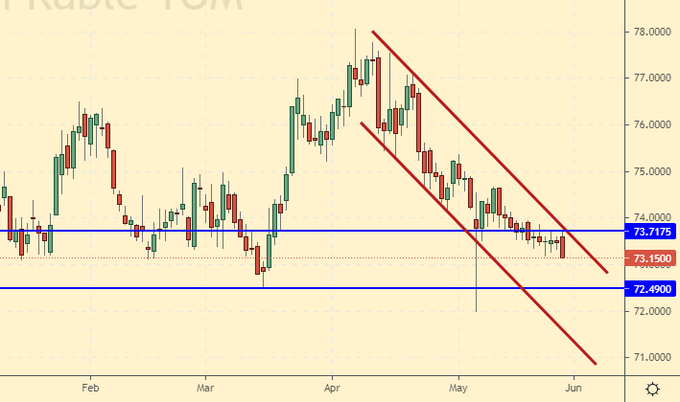
Growth scenario: amid a possible Putin-Biden meeting, the ruble is strengthening. Is it possible to reduce the sanctions pressure from the West? In the long term, yes, if the Kremlin is ready to use its influence in directions interesting to Washington, for example, such as Tehran, Beijing or Ankara.
At this stage, we are not talking about any fulfillment of the requirements of the West in principle. Here the parties will remain in their positions without a doubt.
It is possible that the dollar will lose weight before the Fed meeting on June 16th. Much will further depend on Powell’s press conference. As long as we are below 74.00, we do not buy the pair.
Falling scenario: who went short last week, hold the position. The move to 71.20 is possible.
Purchase: after prices return above 74.30. Stop: 73.30. Target: 80.00.
Sale: no. Those who are in positions between 74.40 and 73.70, move the stop to 73.80. Target: 71.20.
Support — 72.49. Resistance — 73.71.
RTSI
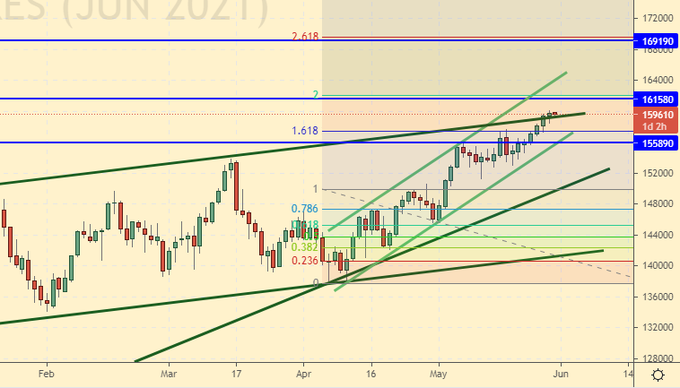
Growth scenario: the index seeks to accelerate its growth and exit the growing flat channel upwards. It cannot be ruled out that against the background of positive development on world exchanges and against the background of the strengthening of the ruble, we will see a visit to the 169,000 mark.
Falling scenario: we see a slight slowdown in growth. A rollback to 155000 is possible. We will not give in to temptation for now. Let’s go short either from 169000, or after falling below 151000. Recommendations:
Purchase: no. Whoever is in position from 155800, keep the stop at 154800. Target: 169000.
Sale: think when falling below 151000. Or when touching 169000. Stop: 172700. Target: 155700.
Support — 155890. Resistance — 161580.
The recommendations in this article are NOT a direct guide for speculators and investors. All ideas and options for working on the markets presented in this material do NOT have 100% probability of execution in the future. The site does not take any responsibility for the results of deals.


