03 March 2025, 13:24
Price forecast from 3 to 7 March 2025
-

What a beautiful scandal in the White House! “I don’t believe it!” shouts the great Stanislavsky to you from there! We have to keep working on the staging. The pauses, the lines. It’s not even a kapustnik. We are waiting for public drunkenness in the performance of the first persons, use of drugs, belly dancing and everything, everything… like in the baths of Ancient Rome, right here, right now and all this for the taxpayers’ money.
To negotiating. Hello!
This release was prepared with the direct participation of analysts from trading platforms eOil.ru and IDK.ru. Here is an assessment of the situation on the global and Russian markets.
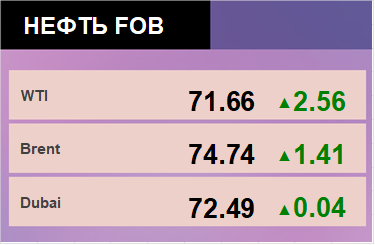
Energy market:
You know, there are rumors that not everyone in OPEC agrees with the current production curb. This does not make the market nervous yet, if it were so, we would have been at 60.00 a long time ago. It is possible that after March, i.e. a month from now, a renegotiation of the deal will start, and this could really send Brent to 60.00, and maybe even a bit lower. But if the voices of the revision fans get stronger, we may see 60.00 sooner.
Despite sanctions, Russia manages to continue supplying oil to India and China. India is doing worse, while China is doing fine. The market is not paying much attention to “nerves”, which suggests that we may see a tendency to shorts among some speculators, as the threat of reduction of Russian exports does not touch or scare anyone, in fact, there is room to take.
In recent news, it is worth noting that if military actions and preparations for such take on a larger scale in Europe, it will affect oil demand and increase logistical problems.
Grain market:
We see prices falling amid falling weather fears in Europe and the US.
China’s opposition to U.S. sanctions could include reducing its purchases of U.S. agricultural products, which could cause warehouses in the U.S. to overflow, which would cause us to see prices fall in Chicago, which would affect pricing around the world. And China will take somewhere else and possibly even more expensive than the US could offer. That’s what a trade war is all about.
Let’s assume for a second that what we have seen from Washington is not an acted out skit between the presidents of the United States and Ukraine, but an actual clash. These two countries have a strong influence on the food market, and if further tensions rise and it becomes clear that Ukraine can’t supply anything because of increased military activity, that could support prices for a while.
Yes, as long as we’re going down. In general, the situation is favorable for buyers. It is not necessary to take at current prices. We will write about interesting lows, below which the market is not seen. Most likely, they will again be related to the trade war between the U.S. and China. For wheat it may be the level of 400.0, for corn 250.0!!! If that happens in reality, sell everything, buy grain. Next year farmers in the U.S. at these prices will drop everything and go salmon fishing in Alaska, and the price will triple.
USD/RUB:
The tragedy has apparently begun to degenerate into a farce. This is to Russia’s advantage, as “it” is flying around the world. But investors, and not only, do not yet understand what will happen next. Yes, you can bet on buying on the Russian stock market and believe in a strong ruble, but the current situation is far more exciting than simply waiting for a recovery after the end of the market cycle. The berries are clearly ahead of us.
Most likely, the Central Bank will not raise the rate even more on March 21, as it will balance between fighting inflation and preserving at least some conditions for doing business. So far the ruble is seen at 100.00. We will go to 80.00 only in case of some real steps on completion of the SWO. But for now it is too early to talk about it.
P.S. With the opening of the American embassy, we are expecting an exodus of young people from the country. They will even give us airplanes themselves. They’ll also provide them with a salary. This is bad. It’s bad for the ruble, it’s bad for the country.
Brent. ICE
Let’s look at the open interest volumes for Brent. You should take into account that this is three days old data (for Tuesday of last week), and it is also the most recent data published by the ICE exchange.
At the moment there are more open long positions of asset managers than short ones. Over the past week the difference between long and short positions of asset managers decreased by 44.6 thousand contracts. Buyers fled, sellers hesitantly arrived in small volumes. Bulls are in control of the situation.
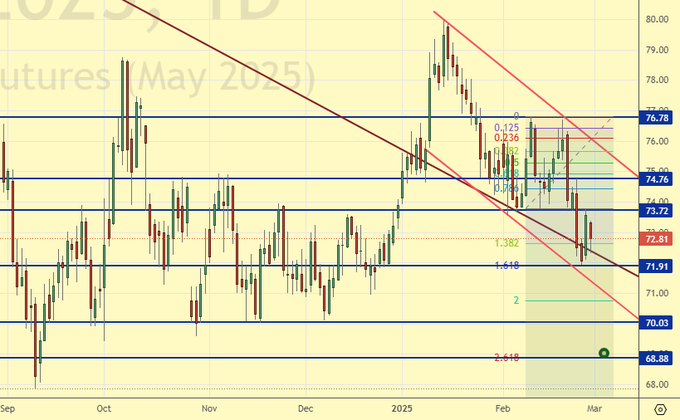
Growth scenario: we switched to March futures, expiration date is March 31. The market fell under 73.50. It crosses the bulls’ ambitions. We will buy only when approaching 69.00. Better at 60.00.
Downside scenario: the market is looking for new ideas at the bottom. We’re shorting. As long as we are below 75.00, sellers have the advantage.
Recommendations for the Brent oil market:
Buy: think when approaching 69.00.
Sell: no. Those who are in the position from 74.05, move the stop to 75.10. Target: 60.00.
Support — 71.91. Resistance — 73.72.
WTI. CME Group
US fundamental data: the number of active drilling rigs decreased by 2 units to 486.
US commercial oil inventories fell by -2.332 to 430.161 million barrels, with +2.5 million barrels forecast. Gasoline stocks rose 0.369 to 248.271 million barrels. Distillate stocks rose 3.908 to 120.472 million barrels. Cushing storage stocks increased by 1.282 to 24.573 million barrels.
Oil production increased by 0.005 to 13.502 million barrels per day. Oil imports increased by 0.099 to 5.919 million barrels per day. Oil exports fell by -0.193 to 4.188 million barrels per day. Thus, net oil imports rose by 0.292 to 1.731 million barrels per day. Oil refining rose by 1.6 to 86.5 percent.
Gasoline demand rose 0.215 to 8.454 million barrels per day. Gasoline production fell -0.02 to 9.17 million barrels per day. Gasoline imports rose 0.116 to 0.462 million barrels per day. Gasoline exports fell -0.049 to 0.849 million barrels per day.
Distillate demand fell by -0.267 to 4.097 million barrels. Distillate production rose by 0.439 to 5.162 million barrels. Distillate imports rose 0.103 to 0.37 million barrels. Distillate exports fell -0.041 to 0.877 million barrels per day.
Demand for refined products increased by 1.189 million barrels to 20.842 million barrels. Petroleum products production increased by 1.146 to 21.661 million barrels. Petroleum product imports fell -0.047 to 1.645 million barrels. Exports of refined products fell -1.64 to 5.356 million barrels per day.
Propane demand rose by 0.596 to 1.918 million barrels. Propane production fell -0.008 to 2.657 million barrels. Propane imports rose 0.003 to 0.135 million barrels. Propane exports fell -0.582 to 1.406 million barrels per day.
Let’s look at the WTI open interest volumes. You should take into account that this is three-day old data (for Tuesday of last week), and it is also the most recent data published by the CME Group exchange.
At the moment there are more open long positions of asset managers than short ones. Over the past week the difference between long and short positions of asset managers decreased by 37.1 thnd contracts. Buyers fled. Sellers were actively coming to the market in good volumes. Bulls are maintaining control.
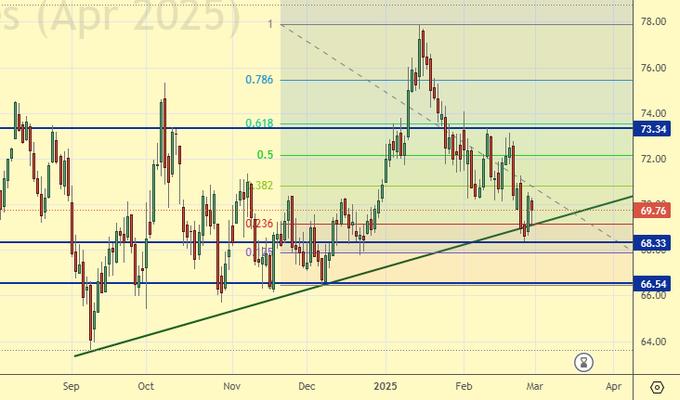
Growth scenario: we consider April futures, expiration date March 20. Beautiful development of the upward impulse did not turn out. Still out of the market.
Downside scenario: we can sell. If we can’t go up in the next couple of days, it could lead to a collapse.
Recommendations for WTI crude oil:
Buy: no.
Sell: now (69.76). Stop: 70.70. Target: 55.00?!
Support — 68.33. Resistance — 73.34.
Gas-Oil. ICE
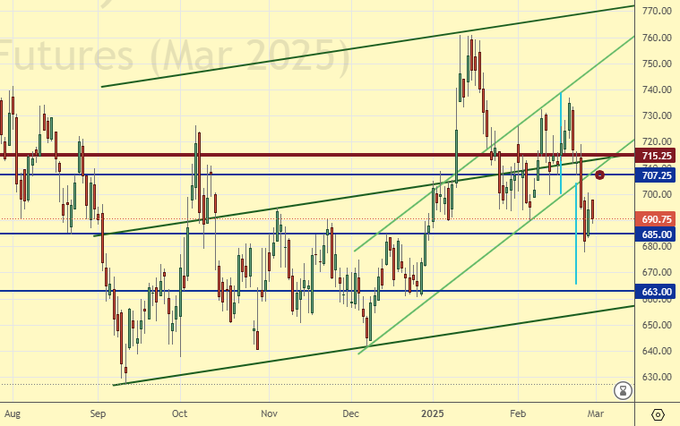
Growth scenario: we consider the March futures, expiration date March 12. It is worth recognizing that purchases may be closed, as the market is able to go lower. Let’s put a stop order.
Downside scenario: if there is a rise, it can be used to enter short.
Gasoil Recommendations:
Buy: no. Those in position from 701.75, move stop to 677.0. Target: 900.0.
Sell: on approach to 707.0. Stop: 715.0. Target: 600.0
Support — 685.00. Resistance — 707.25
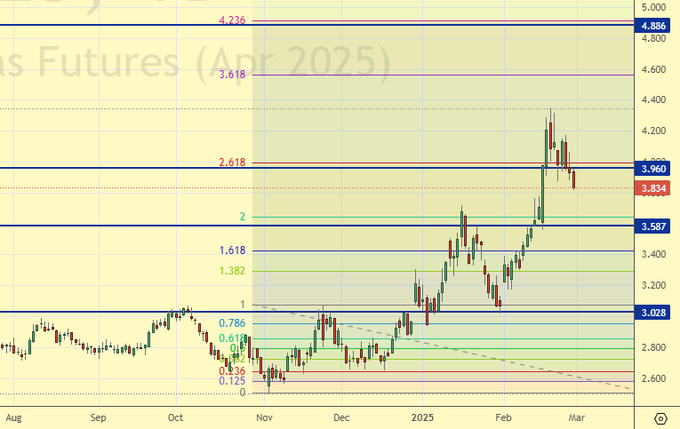
Natural Gas. CME Group
Growth scenario: we consider April futures, expiration date March 27. We took away a piece of growth from the market. Now we take a pause.
Downside scenario: a short would be very interesting from 4.890. Do not sell at current levels.
Natural Gas Recommendations:
Buy: no.
Sale: no.
Support — 3.587. Resistance — 3.960.
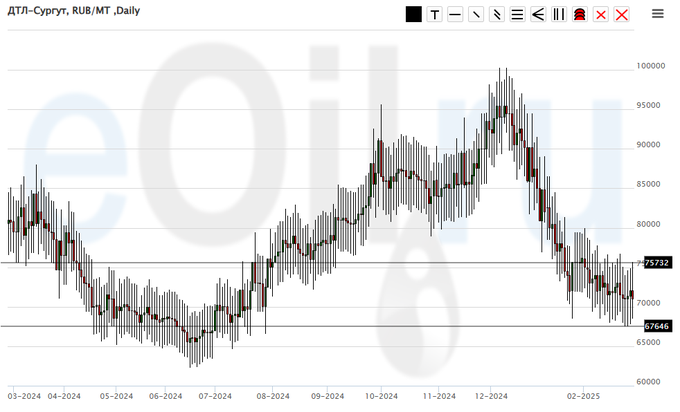
Diesel arctic fuel, ETP eOil.ru
Growth scenario: we should buy here. Technically, the situation is favorable.
Downside scenario: we will not sell anything. There is a constant risk of a sudden rise in prices.
Diesel Market Recommendations:
Buy: no. Who is in position from 71000, keep stop at 67000. Target: 110000.
Sale: no.
Support — 67646. Resistance — 75732.
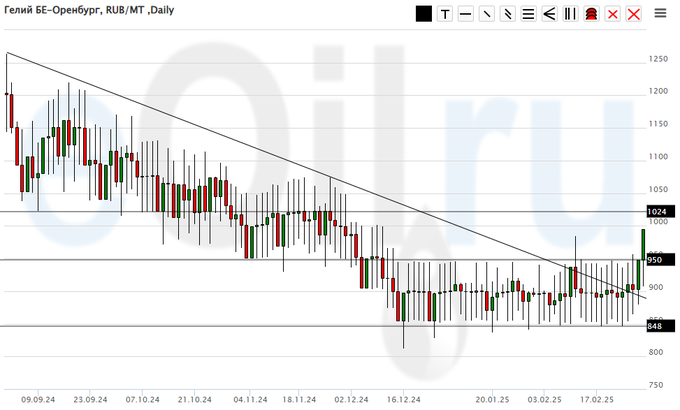
Helium (Orenburg), ETP eOil.ru
Growth scenario: we have been waiting for this movement for a long time. Someone came in and started buying helium. He’s probably building an airship. He wants to fly somewhere.
Downside scenario: stay out of the market, prices are low.
Helium market recommendations:
Buy: no. Those in position from 900, move stop to 830. Target: 2000.
Sale: no.
Support is 950. Resistance — 1024.
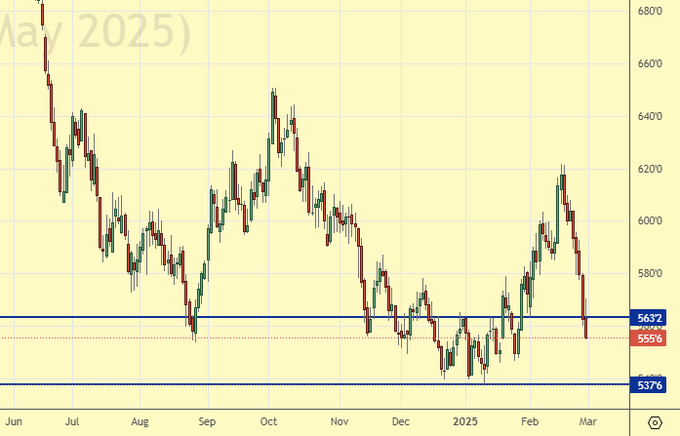
Wheat No. 2 Soft Red. CME Group
Let’s look at the volumes of open interest in Wheat. You should take into account that this is three days old data (for Tuesday of last week), but it is also the most recent data published by CME Group.
At the moment there are more open short positions of asset managers than long ones. Over the past week, the difference between long and short positions of asset managers increased by 17.3 thousand contracts. There were more sellers, and less buyers. The volumes of position changes were commensurate. Bears are controlling the situation.
Growth scenario: we switched to the May contract, expiration date May 14. But they did not give us new highs. In this situation we realize that wheat cannot be infinitely cheap. We will buy. Even if we go below 400.0, we will buy there too.
Downside scenario: 550.0 is some equilibrium level (very long term) counting on prices to go below it is possible, but it is a bad strategy. Out of market.
Recommendations for the wheat market:
Buy: now (555.6). Stop: 544.0. Target: 630.0.
Sale: no.
Support — 537.6. Resistance — 563.2.
Corn No. 2 Yellow. CME Group
Let’s look at the volumes of open interest in Corn. You should take into account that this data is three days old (for Tuesday of last week), it is also the most recent of those published by the CME Group exchange.
At the moment there are more open long positions of asset managers than short ones. Over the past week the difference between long and short positions of asset managers decreased by 25.9 thousand contracts. The bulls ran, the sellers did not. Bulls continue to control the situation.
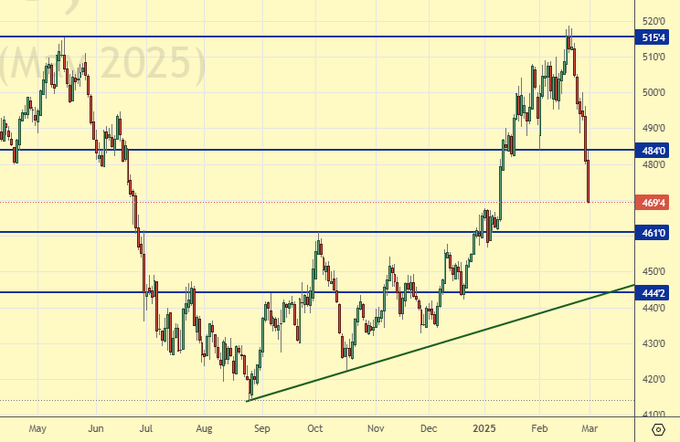
Growth scenario: we switched to the May contract, expiration date May 14. We are approaching 460.0. It is possible to think about purchases. At the same time, we cannot deny the move to 440.0 and 420.0. We will buy.
Downside scenario: it makes no sense to sell at current prices. Out of the market.
Recommendations for the corn market:
Buy: when approaching 461.0. Stop: 457.0. Target: 510.0. Also when approaching 444.0. Stop: 434.0. Target: 510.0. When buying it makes sense to wait for the average green candle at least on hourly intervals.
Sale: no.
Support — 461.0. Resistance — 484.0
Soybeans No. 1. CME Group
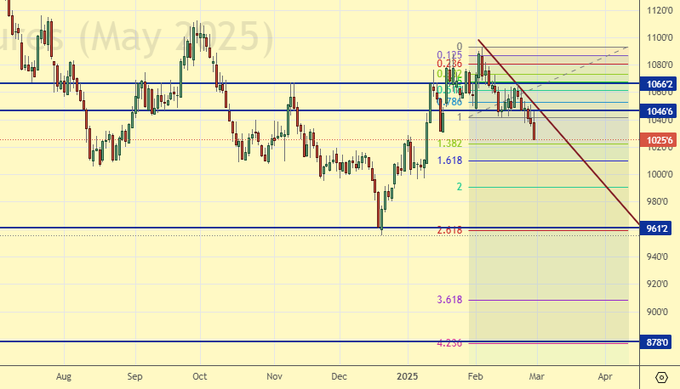
Growth scenario: switched to May contract, expiration date May 14. The market is not able to grow now. Do not buy.
Downside scenario: given the depression in the grain market, we may sell. Not too comfortable levels, but in general we can count on 880.0. Soybeans are plentiful.
Recommendations for the soybean market:
Buy: no.
Sell: now (1025.6) and on the rise to 1044.0. Stop: 1056.0. Target: 878.0. The deal is not very good. Consider the risks.
Support — 961.2. Resistance — 1046.6.
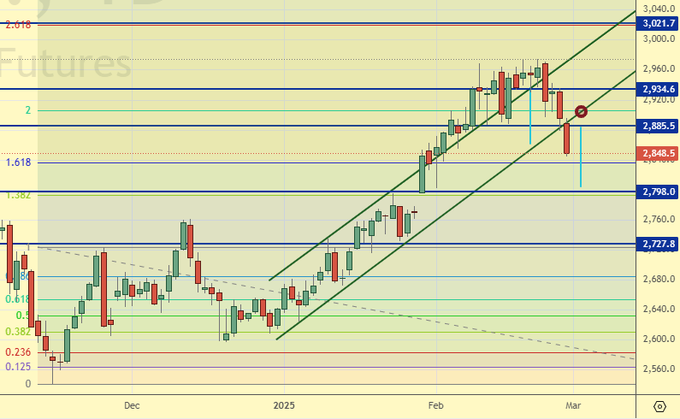
Growth scenario: we consider March futures, expiration date March 27. When approaching 2730 it is possible to buy. But it is hardly worth risking a large percentage of capital in such a deal.
Downside scenario: we couldn’t make it to 3020. Cooling started earlier. We can make an attempt to enter short on the corrective rise to 2910.
Gold Market Recommendations:
Buy: when approaching 2730. Stop: 2710. Target: 3020.
Sell: when approaching 2910. Stop: 2940. Target: 2120.
Support — 2798. Resistance — 2885.
EUR/USD
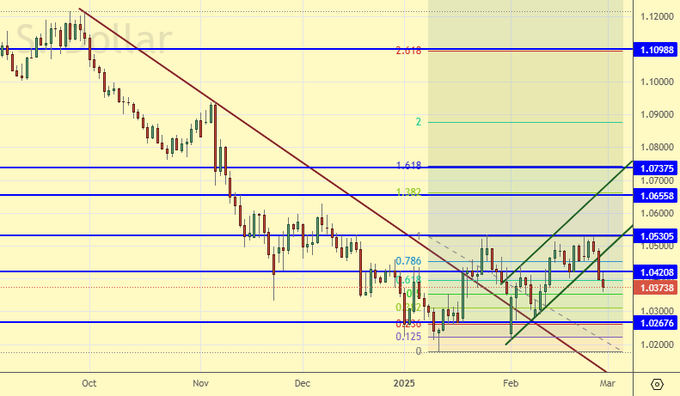
Growth scenario: “bulls need to go above 1.0530”, — we wrote a week earlier. As a matter of fact, we see that they could not do it. There is a risk of a move to parity. Outside the market.
Downside scenario: in such a situation, it is best to sell on a rise to 1.0450. If the market does not give such an opportunity, it is better to do nothing.
Recommendations on euro/dollar pair:
Buy: no.
Sell: on a rise to 1.0450. Stop: 1.0480. Target: 0.9900. Think in case of a move below 1.0300.
Support — 1.0267. Resistance — 1.0420.
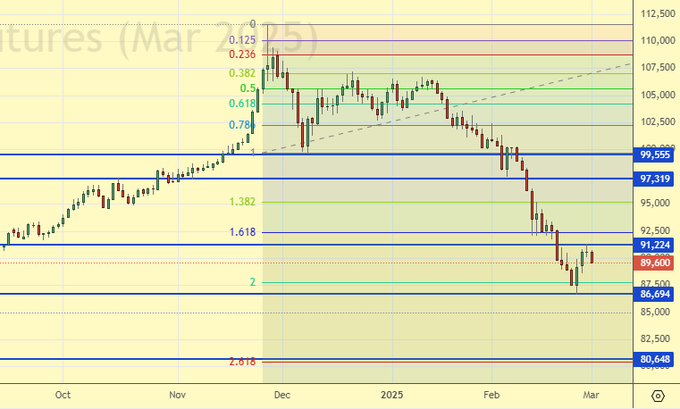
USD/RUB
Growth scenario: we consider the March futures, expiration date March 20. From 81000 to buy unambiguously, higher levels are uncomfortable, but we should also try to take there, as we cannot miss the move to 115000 (and it is possible).
Downside scenario: stopped at 87000. We may continue to strengthen if it becomes clear that there is a real prospect of completion of SWO.
Recommendations on dollar/ruble pair:
Buy: when approaching 87500. Stop: 86500. Target: 97300. Also when approaching 81000. Stop: 79000. Target: 115000?!!!
Sale: no.
Support — 86694. Resistance — 91224.
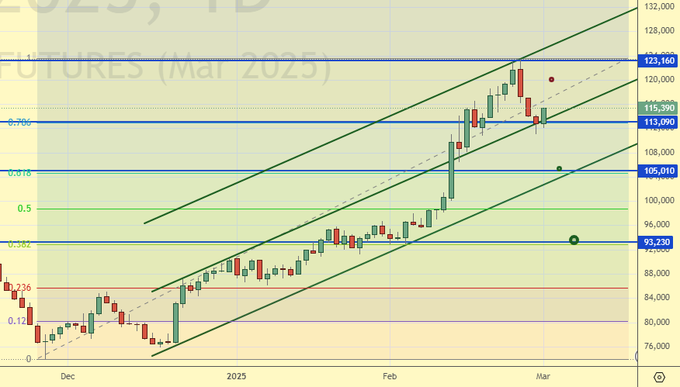
RTSI. MOEX
Growth scenario: we consider March futures, expiration date March 20. Long-term level of 93000 is interesting. If we will be there, then buy. Long from 105000 is not so interesting, but it is possible.
Downside scenario: if there will be an approach to 120000 — sell. Within the correction we can draw the trajectory 120000 — 105000.
Recommendations on the RTS index:
Buy: when approaching 105000. Stop: 103000. Target: 138000?!!! Also on approach to 93300. Stop: 91300. Target: 110000.
Sell: when approaching 120000. Stop: 122,000. Target: 105000.
Support — 113090. Resistance — 123160.
The recommendations in this article are NOT a direct guide for speculators and investors. All ideas and options for working on the markets presented in this material do NOT have 100% probability of execution in the future. The site does not take any responsibility for the results of deals.