25 January 2021, 11:32
Price forecast from 25 to 29 of January 2021
-
Energy market:
Cold weather in Europe and Asia contributes to the increased demand for gas and higher prices for blue fuel. The price tag reaches $ 1000 per 1000 cubic meters in Asia, which forces Russian companies involved in LNG projects to reorient all their resources to the Asian market.
And in the current situation, Gazprom is going to teach Europe a lesson, since there is no talk of any increase in supplies to the West. In Warsaw where the thermometer dropped to minus 26 Celsius, some of the conscious, slightly freezing citizens are already wondering where the promised friendly American gas is, which we have been so heavily advertised for several years. There should be a lot of gas in Poland. It should be cheap.
Oil tends to turn down. In the US last week, an increase in commercial oil reserves was recorded, in addition, the growth in the number of drilling rigs continued. These two factors, under normal conditions, without a series of lockdowns, by themselves were capable of turning the market down. In the current «quarantine» circumstances, despite the OPEC + deal, these two factors only add fuel to the fire. The bulls are unlikely to be able to withstand the selling pressure next week. We are waiting for a pullback to $ 50.00 per barrel for Brent.
Grain market:
The wheat market stopped to grow immediately after Egypt refused to buy expensive Russian wheat, having failed to see an acceptable offer at the tender. Physical delivery traders will have to moderate their appetites in the next couple of weeks, as after the growth stage it is time to rethink price levels.
There is a problem with winter crops in the Stavropol. If February is cold and snowless, then up to 80% of winter crops may not germinate. The rainfall that fell in January did not bring relief, according to farmers. The snow melts in the fields due to the periodic above-zero temperatures, the water goes into the ground, and there is no snow that should protect the plants from possible frost in February in the fields.
USD/RUB:
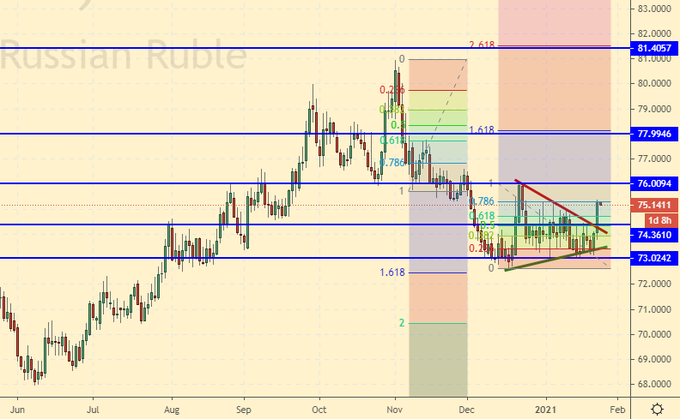
The RGBI index continues to fall, what worsens the already alarming situation around the ruble.
The national currency could not cope with the political negativity that comes from Washington and Brussels. The story with Navalny, his arrest, protests on Saturday, all this creates additional pressure on the ruble. The pair chose the way up to 80.00, supposing that we can see a gap up on Monday.
Two consecutive strong blows on the ruble on Thursday and Friday morning, immediately after Biden’s inauguration, are noteworthy. What it is? Collusion? Of course yes. After all, there are no statistics or news in the morning, there is nothing to react to. Everyone just got out of bed and put on soft slippers.
The central event of the next week is the US Federal Reserve meeting on the 27th. Any hint in the press release about inflation in the country will give a boost to the dollar and loosen the commodity market.
Brent. ICE
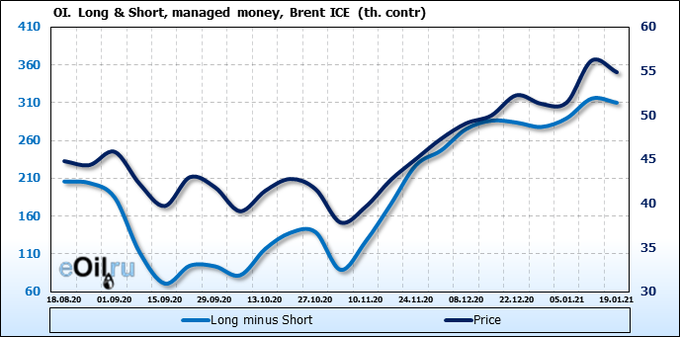
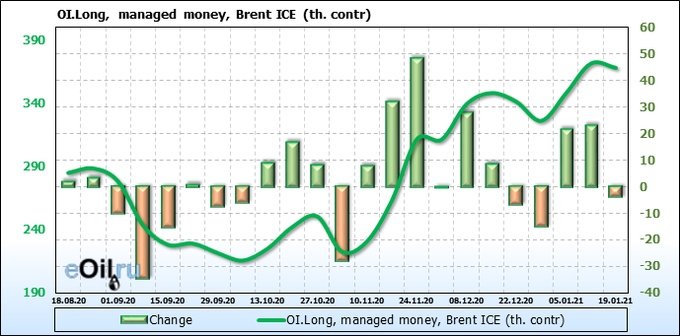
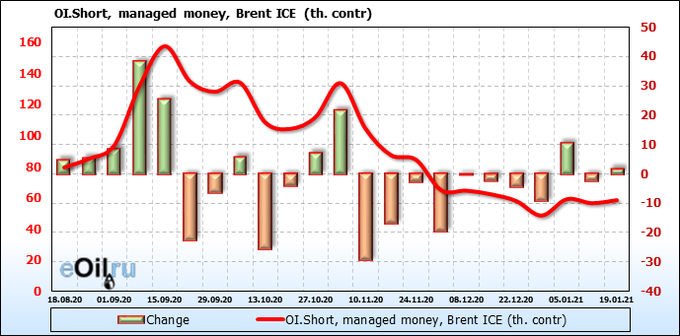
We’re looking at the volume of open interest of managers. You should keep in your mind that these are data from three days ago (for Tuesday of the past week), they are also the most recent of those published by the ICE exchange.
Judging by the open interest, which has hardly changed over the week, there is no idea on the market. There must be a group of daredevils who will strike in one direction or another against the background of some news.
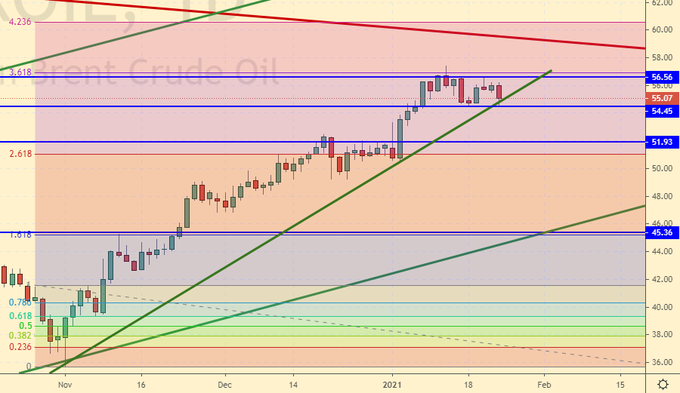
Growth scenario: January futures, expiration date January 29. We continue to wait for a rollback. Buying from current levels looks too risky.
Falling scenario: red Friday gives us hope for a descent to 52.00. You can sell here. Recommendation:
Purchase: look for opportunities in the fall to 46.00. Sale: now. Stop: 56.70. Target: 46.00. Those who are in the position from 54.80, move the stop to 56.70. Target: 46.00.
Support — 54.45. Resistance — 56.56.
WTI. CME Group
Fundamental US data: the number of active drilling rigs increased by 2 units to 289 units.
Commercial oil reserves in the US rose by 4.352 to 486.563 million barrels. Gasoline inventories fell by -0.259 to 245.217 million barrels. Distillate stocks rose by 0.457 to 163.662 million barrels. Cushing’s stocks fell -4,727 to 52.5 million barrels.
Oil production has not changed at 11 million barrels per day. Oil imports fell by -0.194 to 6.045 million barrels per day. Oil exports fell by -0.76 to 2.251 million barrels per day. Thus, net oil imports rose by 0.566 to 3.794 million barrels per day. Oil refining increased by 0.5 to 82.5 percent.
Gasoline demand rose 0.58 to 8.112 million barrels per day. Gasoline production increased by 1.373 to 8.885 million barrels per day. Gasoline imports rose by 0.121 to 0.504 million barrels per day. Gasoline exports rose by 0.133 to 0.731 million barrels per day.
Distillate demand rose 0.212 to 3.821 million barrels. Distillate production fell by -0.132 to 4.529 million barrels. Distillate imports rose 0.114 to 0.46 million barrels. Distillate exports rose 0.388 to 1.102 million barrels per day.
The demand for petroleum products increased by 0.035 to 19.642 million barrels. Production of oil products increased by 1.145 to 20.45626 million barrels. Imports of petroleum products rose by 0.35 to 2.137 million barrels. Exports of petroleum products rose 0.275 to 5.404 million barrels per day.
Propane demand fell by -0.225 to 1.879 million barrels. Propane production fell by -0.045 to 2.295 million barrels. Propane imports rose 0.025 to 0.174 million barrels. Propane exports rose 0.133 to 1.48 million barrels per day.
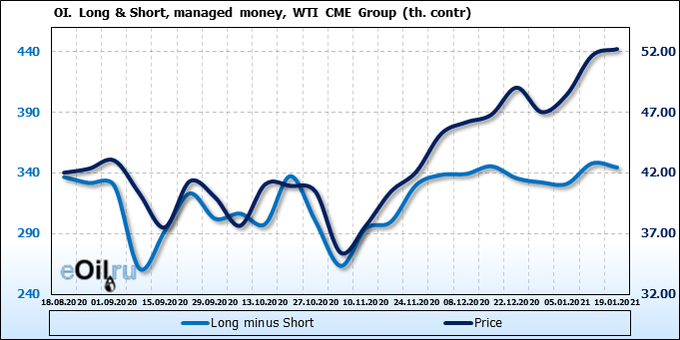
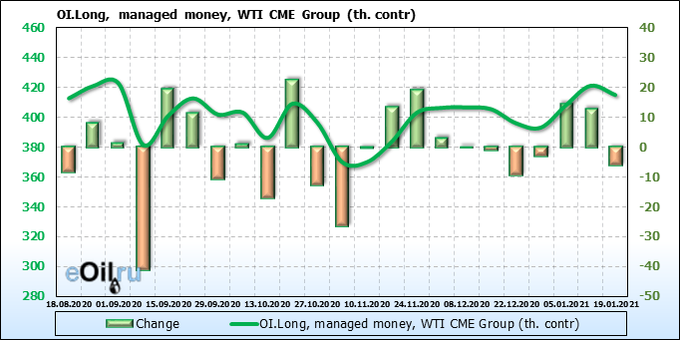
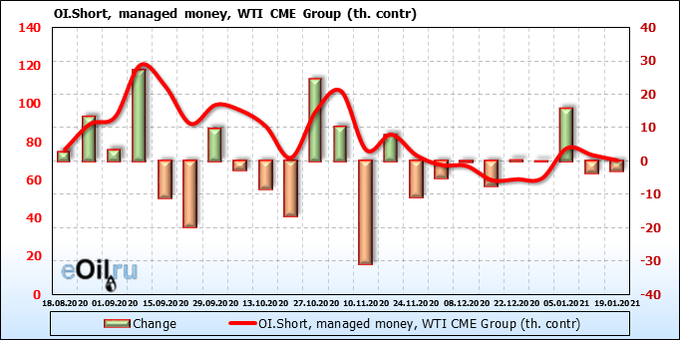
We’re looking at the volume of open interest of managers. You should keep in your mind that these are data from three days ago (for Tuesday of the past week), they are also the most recent of those published by the CME Group.
The bulls stopped pushing the market. We see a slight closing of positions. At the same time, sellers are in no hurry to build up pressure. There is uncertainty in the market, apparently before the Fed meeting.
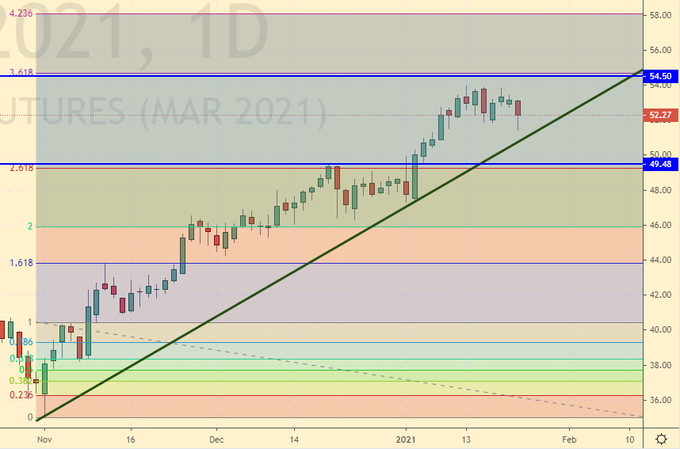
Growth scenario: March futures, expiration date February 22. New local minimum was shown on Friday. We pretend to break the long-term support line. We continue to count on a pullback to 46.00. Do not buy.
Falling scenario: if the market falls below 52.00, you can sell. Those who are already in shorts, hold positions.
Recommendation:
Purchase: no. A correction is needed, at least to the area of 46.00.
Sale: after falling below 52.00. Stop: 53.86. Target: 46.00. Those who are in the position from 52.40, move the stop to 53.86. Target: 46.00.
Support — 49.48. Resistance — 54.50.
Gas-Oil. ICE
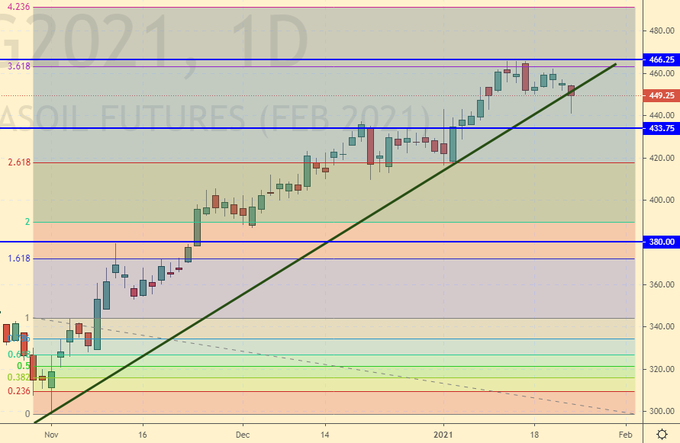
Growth scenario: February futures, expiration date February 11th. We see a break through the support line. We look forward to continued price decline. The current levels for purchases are too high.
Falling scenario: if the market falls below 440.0, you can sell. The long lower shadow of the Friday candlestick raises concerns, so it is better to wait for confirmation.
Recommendation:
Purchase: no. Wait for a rollback to 370.0.
Sale: no. Think when falling below 440.0. Consider the risks.
Support — 433.75. Resistance — 466.25.
Natural Gas. CME Group
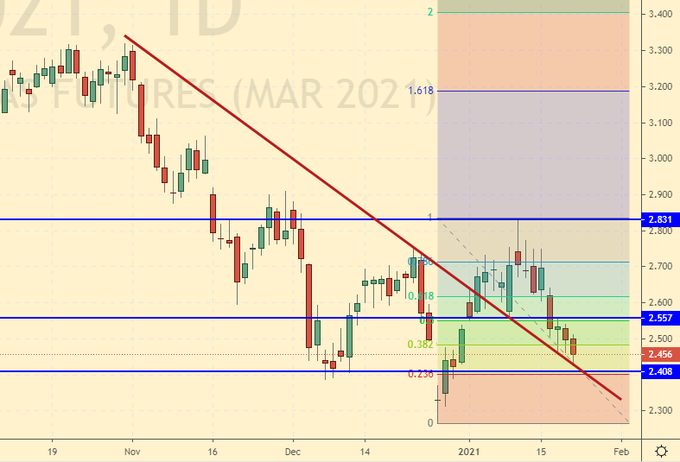
Growth scenario: March futures, expiration date February 24. Here you have to buy. Gazprom did not increase supplies to Europe so that the «partners» would take more from the storage facilities. This maneuver could lay the foundation for price increases.
Falling scenario: do not sell. It’s cold in Europe.
Recommendation:
Purchase: now. Stop: 2.390. Target: 3.150.
Sale: no.
Support — 2.408. Resistance — 2.557.
Wheat No. 2 Soft Red. CME Group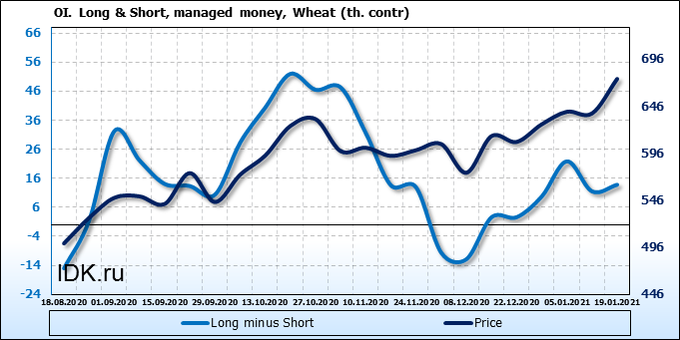
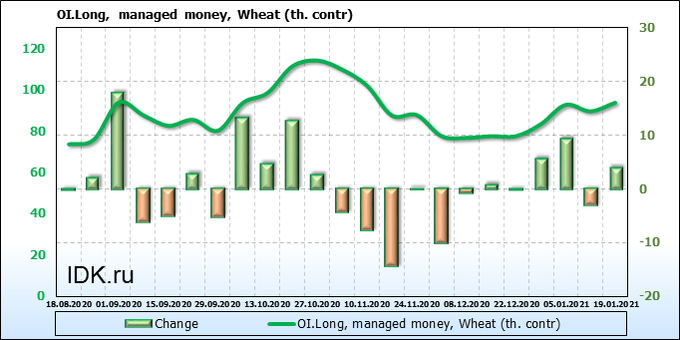
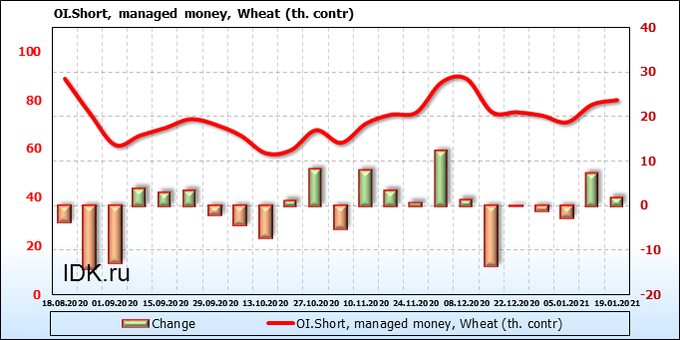
We’re looking at the volume of open interest of managers. You should keep in your mind that these are data from three days ago (for Tuesday of the past week), they are also the most recent of those published by the CME Group.
Both bulls and bears increased their presence in the market. On Friday we see that sellers were ultimately more persistent, which led to a fall in prices. We do not exclude a further increase in sales from speculators.
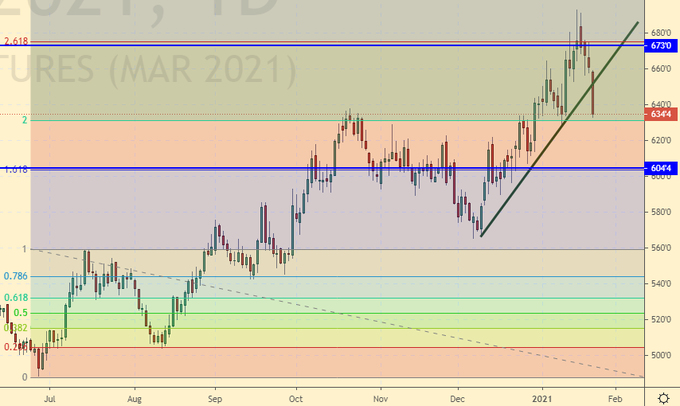
Growth scenario: March futures, expiration date March 12. The red Friday candle is mesmerizing. Long, no shadows. With the breakdown of the aggressive support line. Michelangelo painted worse. We do not buy.
Falling scenario: we will continue to recommend selling, as we did the week before. If after the breakdown of the support line the market rolls back to 655.0, you can sell or build up shorts. Very good if you weren’t knocked out of position last Tuesday. Recommendation:
Purchase: no. We look forward to a fall to 560.0. Sale: on touch 655.0. Stop: 672.0. Target: 560.0.
Support — 604.4. Resistance — 673.0.
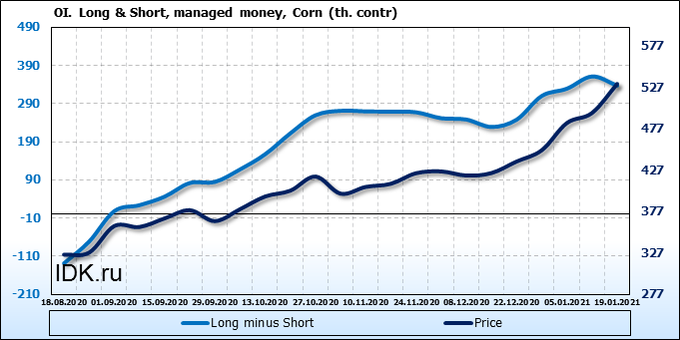
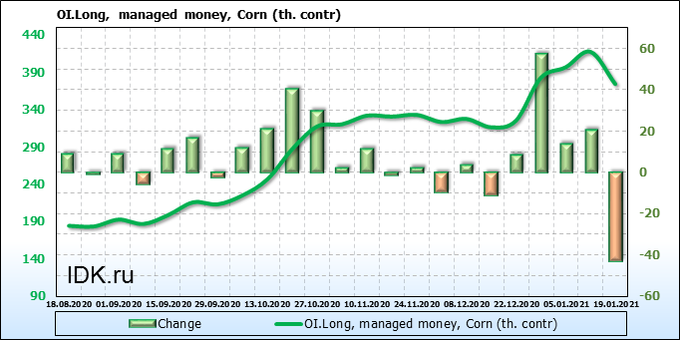
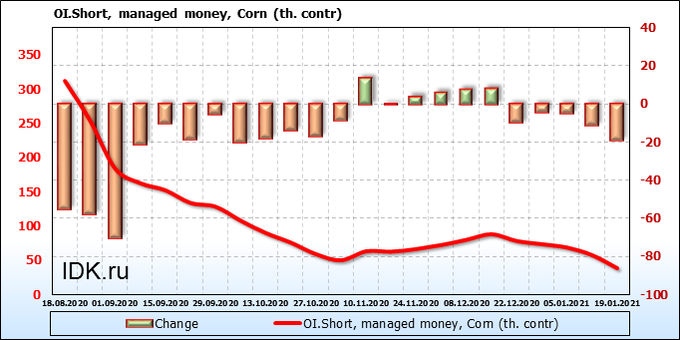
We’re looking at the volume of open interest of managers. You should keep in your mind that these are data from three days ago (for Tuesday of the past week), they are also the most recent of those published by the CME Group.
Only sellers fled from the corn market earlier, but now buyers do the same. Considering that prices ultimately went down on Friday, we can expect an increase in sellers’ activity next week.
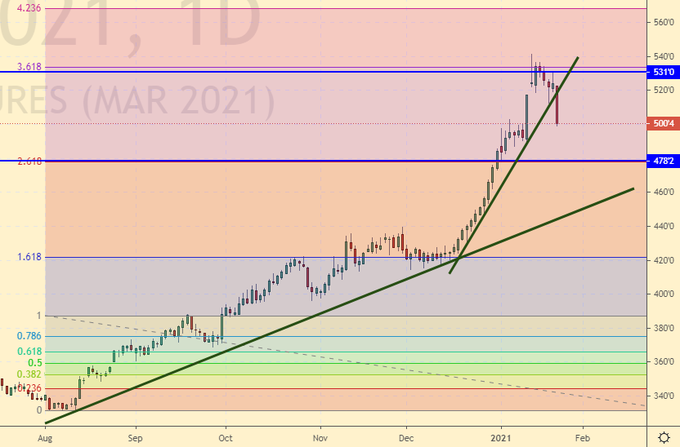
Growth scenario: March futures, expiration date March 12. We continue to demand lower prices for purchases stubbornly. Let’s start thinking about longs no higher than 480.0.
Falling scenario: we see a beautiful long red candlestick down. In case of a rollback to 515.0, sell. If the fall continues without returning up, do not enter the short.
Recommendation:
Purchase: no. Need a rollback.
Sale: on touch 515.0 Stop: 524.0. Target: 460.0.
Support — 478.2. Resistance — 531.0.
Soybeans No. 1. CME Group
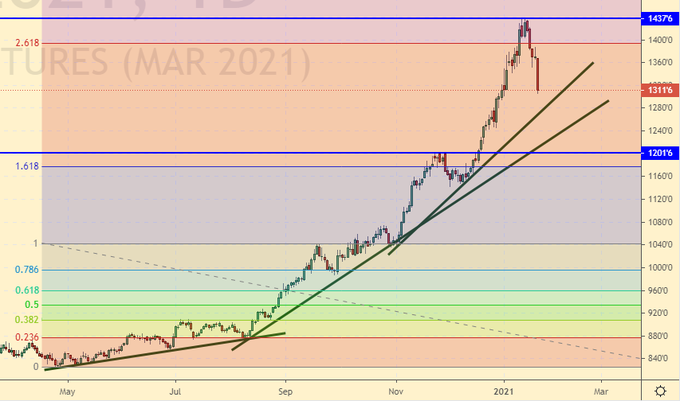
Growth scenario: March futures, expiration date March 12. The market realized on Friday that it was overheated and then fell. In these circumstances, we will wait for the move to the 1210.0 area in order to buy.
Falling scenario: while waiting for a red candlestick, following our recommendations, you could enter short from 1390.0. Now you just need to hold the position counting on the move to 1210.0.
Recommendation:
Purchase: no. We need a rollback to 1210.
Sale: on a rollback to 1360.0. Stop: 1380.0. Target: 1210. Who is in the position from 1390, move the stop to 1380.0. Target: 1210.
Support — 1201.0. Resistance — 1437.0.
Sugar 11 white, ICE
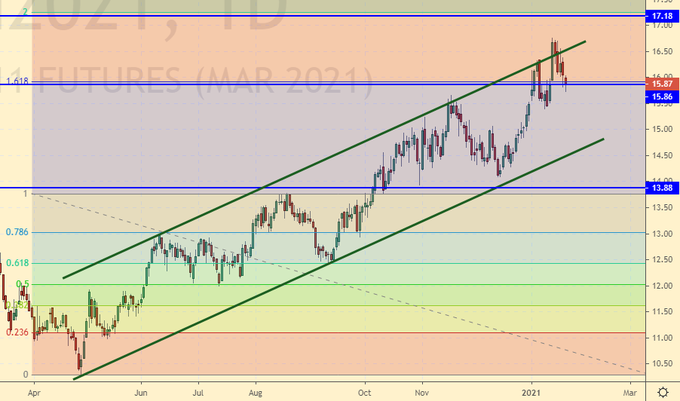
Growth scenario: March futures, expiration date February 26. In the current circumstances, we will expect a rollback to 14.00. The current levels are high. Note that we have not yet reached the target at 17.18.
Falling scenario: if there is a rollback to 16.30 — sell. By 15.00 we are quite capable of getting off without any problems.
Recommendation:
Purchase: no. Need a rollback.
Sale: on touch 16.30. Stop: 16.60. Target: 13.90.
Support — 13.88. Resistance — 17.18.
Сoffee С, ICE
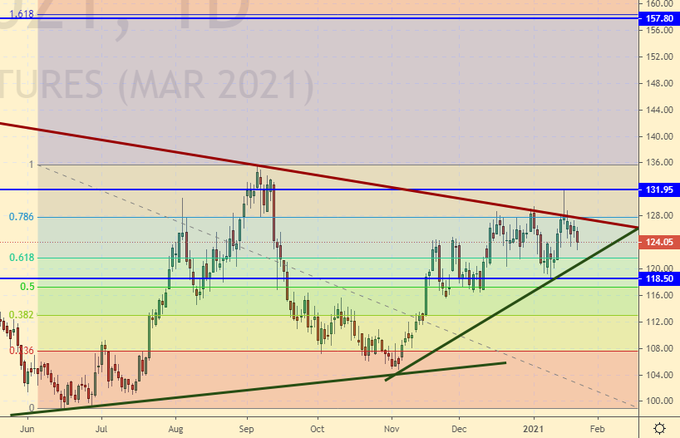
Growth scenario: given the negative sentiment on the agricultural market, we do not buy. It will not be surprising if the quotes return to 100.0.
Falling scenario: sell here. If you are already logged in at the 124.00 touch, then stop.
Recommendation:
Purchase: no.
Sale: now. Stop: 128.10. Target: 108.60. Anyone in the position from 124.00, keep the stop at 128.10. Target: 108.60.
Support — 118.50. Resistance — 131.95.
Gold. CME Group
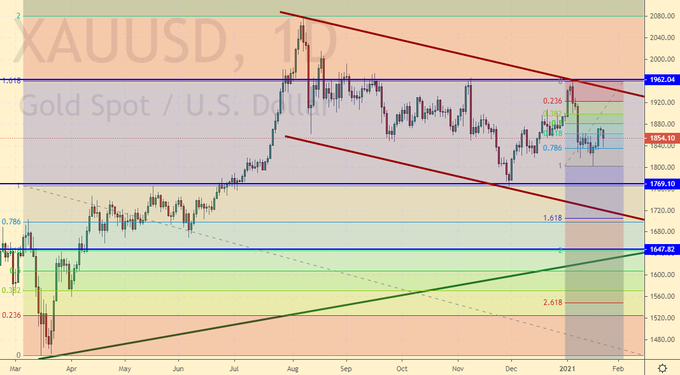
Growth scenario: no growth. However, any options are possible before the Fed meeting on Wednesday. We are unlikely to go below 1800 on Monday and Tuesday. Rather, bidders will wait for the Fed’s press release.
Falling scenario: whoever sold two weeks ago is holding shorts. It makes no sense to open new positions here. Note that the market’s reaction to the Fed meeting is not very predictable. Recommendations:
Purchase: now. Stop: 1787. Target: 2260. Consider the risks!
Sale: no. Anyone in the position from 1920, keep the stop at 1926. Target: 1660.
Support — 1769. Resistance — 1962.
EUR/USD
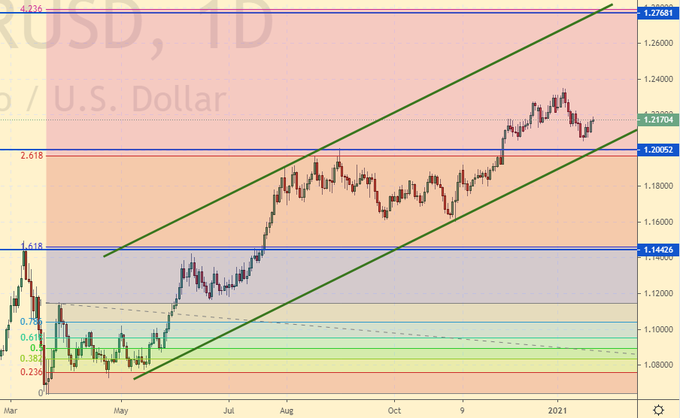
Growth scenario: bulls hold on for now. The move to 1.2700 remains in sight as long as we are above 1.2000. Note that it is best to make buying decisions after the US Federal Reserve meeting. On Wednesday evening we can see false movements.
Falling scenario: it makes sense to hold the shorts for now, especially since the stop is not far away, at 1.2210. If the market goes higher and the position is closed by a stop, we do not open new sales until it falls below 1.2000.
Recommendation:
Purchase: while we are above 1.2000, we can consider buying options, but better after Wednesday.
Sale: no. Whoever is in the position from 1.2220, keep the stop at 1.2210. Target: 1.1460.
Support — 1.2005. Resistance — 1.2768.
USD/RUB
Growth scenario: we see a way out of consolidation upwards. On Monday there may be a gap again upwards by 30-50 kopecks due to the nervous situation about Navalny. Europe demands to release him from custody and threatens with sanctions. Let us also note the positive, the desire of the Americans to extend the START treaty for five years, as the Kremlin proposed, suggests that not all channels of communication with Washington are closed.
Falling scenario: we should probably forget about the movement to 70.00. However, everything could change on Wednesday if the Fed issues a comment similar to the following: “We see no reason to raise the rate even if inflation accelerates, since the economic recovery is in the first place. At this stage, we are not considering the curtailment of quantitative easing and business assistance programs.» That is, there will be a lot of money and it will be cheap. In this case, the dollar may fall. Including the ruble.
Purchase: on a rollback to 74.60. Stop: 74.20. Target: 81.40. Anyone in the position from 73.30, move the stop to 74.20. Target: 81.40.
Sale: no.
Support — 74.36. Resistance — 76.00.
RTSI
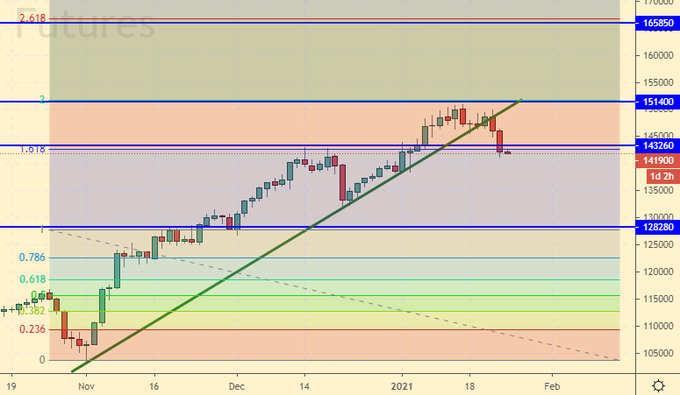
Growth scenario: March futures, expiration date March 18. Prices broke through the support line and went down. Thursday and Friday were extremely unpleasant for the RTS index. Note that the MICEX index, calculated in rubles, also went down. It will be difficult for Russian securities to grow amid political confrontation with Europe and the United States. It is possible that the market will continue to fall on Monday as well. We do not buy.
Falling scenario: The road to 130,000 is open. The rise to 145,000 can be used to build up shorts or to initially enter a position.
Recommendation:
Purchase: no.
Sale: on touch 145000. Stop: 148000. Target: 130000 (100000). Whoever is in position from 147000, keep the stop at 151000. Target: 130000 (100000).
Support — 128280. Resistance — 143260 (151400).
The recommendations in this article are NOT a direct guide for speculators and investors. All ideas and options for working on the markets presented in this material do NOT have 100% probability of execution in the future. The site does not take any responsibility for the results of deals.


