23 May 2022, 12:56
Price forecast from 23 to 27 of May 2022
-
Energy market:
Ursula von der Leyne proposed covering office buildings and then all residential buildings in Europe with solar panels in order to avoid paying more for natural gas from Russia. But this is not true, it is necessary to cover it with mats and cotton robes, then the intensity of heat exchange with the external environment will decrease. And on the other hand, what to tell them, let them cover themselves with whatever they want.
Hello!
Design bureaus in the US have begun designing homes with built-in an oil rig. Joke. Just a joke.
Drilling activity in America is on the rise. We can expect that we will see an attempt to reach the level of 13.5 million barrels of oil per day by the end of the year. Current production is 11.9 million barrels per day. The mood of the American administration is combative. And where to go, otherwise the control of the Republicans over both chambers in Congress in the autumn will be total against the backdrop of a strong rise in fuel prices and the natural discontent of citizens. As long as no one has begun to sing a song about the decline in world GDP, oil prices will be above $100.00 a barrel. But there is a feeling that already in the third quarter we will hear prayers, prayers that the crisis will not be too strong, but that no one will have any doubts about it.
Grain market:
The International Grains Council has released its wheat harvest forecast for the 22/23 season. The data differs from the USDA forecast by 6 million tons down and is at around 769 million tons. IGC’s view is slightly more pessimistic than that of the US Department of Agriculture, but still the indicator is at a comfortable level.
Ukrainian grain began to arrive to buyers through European countries. This is a short-term stabilizing factor. Further, all attention will be focused on the volume of the new crop. Information about the state of crops this summer will be in the spotlight. Global coarse grain production in 2022/23 is projected to decline by 22.5 Mt (1.5%) year-on-year to 1,475.9 Mt. Most of the change is due to a decrease in estimated planting area in the US and a sharp decline in coarse grain planting area in Ukraine, expected to be 31%. In the event of weather problems and reduced yields, a sharp reaction from the markets can be expected.
For wheat, the level of 1400 cents per bushel remains in sight. For corn, we are able to go to the level of 870 cents per bushel. These upward moves can take place in June or later. Much will depend on the discrepancy between the current, generally positive market expectations for gross output, and the actual picture. The market is not visible above the above mentioned marks, since further demand will simply fall due to banal famine in a number of countries, as people will not be able to afford bread at a price that has tripled compared to last year.
The Hindus, finally, must decide whether they will sell wheat for export or not. The market is in a fever. In the city of Delhi, hear us. Practice asanas, meditate. Give a thoughtful answer. Stop scaring.
USD/RUB:
We see that the Central Bank is dissatisfied with the growth of the ruble against the dollar and gradually, through a series of minor relaxations, is returning to free trade. Thus while there is a ban for foreigners on participation in the auctions.
Also, the establishment of a fair exchange rate is hindered by the ban on the part of the US and the EU on the supply of cash to the country. If the pair consolidates below the level of 55.00 rubles per dollar, we should expect the return of the opportunity for foreigners to trade currencies on the Russian stock exchange.
It cannot be ruled out that importers will increase volumes and this will increase the demand for the dollar, but large deliveries of non-food products may take place under pressure from the West on the governments of countries through whose territory the products enter Russia. In particular, pressure on Kazakhstan as a transit country for parallel imports cannot be ruled out in the future.
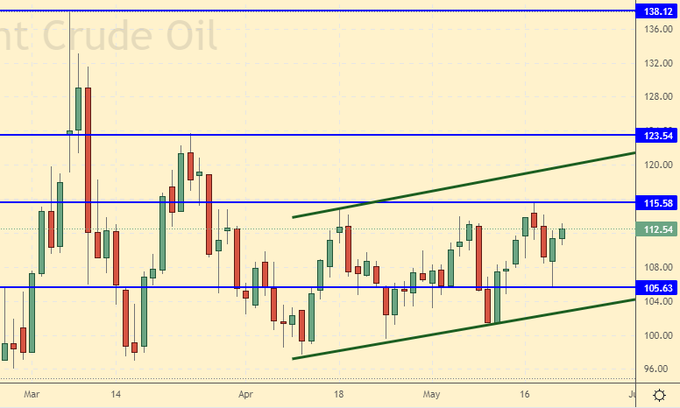
Brent. ICE
We’re looking at the volume of open interest of managers. You should keep in your mind that these are data from three days ago (for Tuesday of the past week), they are also the most recent of those published by the ICE exchange.
Over the past week, the difference between long and short positions of managers increased by 21.6 thousand contracts. The bulls are active. So far, speculators have no faith in the market turning down.
Growth scenario: we are considering the May futures, the expiration date is May 31. We will keep longs. Those who wish will be able to add after the growth above 116.00.
Falling scenario: the possibility of a market fall in this situation cannot be denied. The only embarrassing thing is that the demand is not fully satisfied yet and the deficit in the market remains. From 0.5 to 1 million barrels of oil per day, the economy now receives less. Out of the market.
Recommendation:
Purchase: no. Who is in position from 112.00, move the stop to 107.00. Target: 125.00 (150.00).
Sale: not yet.
Support — 105.63. Resistance is 115.58.
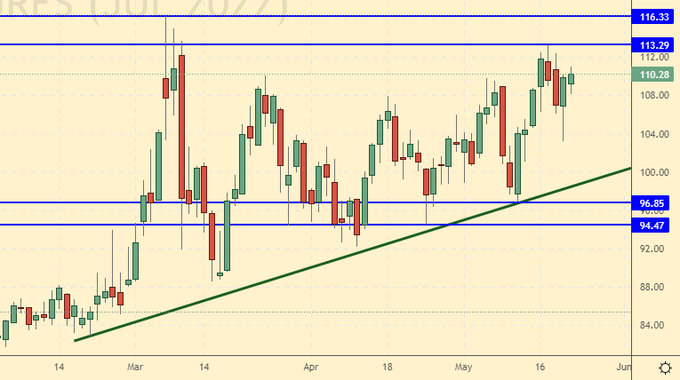
WTI. CME Group
Fundamental US data: the number of active drilling rigs increased by 13 units and now stands at 576 units.
Commercial oil reserves in the US fell by -3.394 to 420.82 million barrels, while the forecast was +1.383 million barrels. Behind gasoline stocks fell -4.779 to 220.189 million barrels. Distillate inventories rose by 1.235 to 105.264 million barrels. Inventories at Cushing fell -2.403 to 25.839 million barrels.
Oil production increased by 0.1 to 11.9 million barrels per day. Oil imports rose by 0.299 to 6.568 million barrels per day. Oil exports rose by 0.641 to 3.52 million barrels per day. Thus, net oil imports fell by -0.342 to 3.048 million barrels per day. Oil refining increased by 1.8 to 91.8 percent.
Gasoline demand rose by 0.325 to 9.027 million barrels per day. Gasoline production fell by -0.142 to 9.574 million barrels per day. Gasoline imports rose by 0.181 to 0.876 million barrels per day. Gasoline exports rose by 0.015 to 0.957 million barrels per day.
Demand for distillates rose by 0.039 to 3.816 million barrels. Distillate production fell -0.002 to 4.88 million barrels. Distillate imports fell -0.008 to 0.114 million barrels. Distillate exports fell -0.355 to 1.002 million barrels per day.
Demand for petroleum products increased by 0.43 to 19.661 million barrels. Oil products production fell by -0.551 to 20.95 million barrels. Imports of petroleum products increased by 0.178 to 1.995 million barrels. The export of oil products increased by 0.136 to 6.044 million barrels per day.
Demand for propane rose by 0.284 to 1.061 million barrels. Propane production fell by -0.04 to 2.329 million barrels. Propane imports fell -0.004 to 0.087 million barrels. Propane exports rose by 0.118 to 1.313 million barrels per day.
We’re looking at the volume of open interest of WTI managers. You should keep in your mind that these are data from three days ago (for Tuesday of the past week), they are also the most recent of those published by the ICE.
Last week the difference between long and short positions of managers increased by 41.7 thousand contracts. Bulls increase their influence. Growth is strong. We can assume that large players will enter the market.
Growth scenario: we are considering the July futures, the expiration date is June 21. We will keep open last week longs. In case of a break above 117.00, you can add.
Falling scenario: short is possible. But it’s better to wait. If next week the bulls fail to set a new local maximum, then it will be possible to talk about sales.
Recommendation:
Purchase: no. Who is in position from 109.00, move the stop to 103.00. Target: 150.00.
Sale: not yet.
Support — 96.85. Resistance is 113.29.
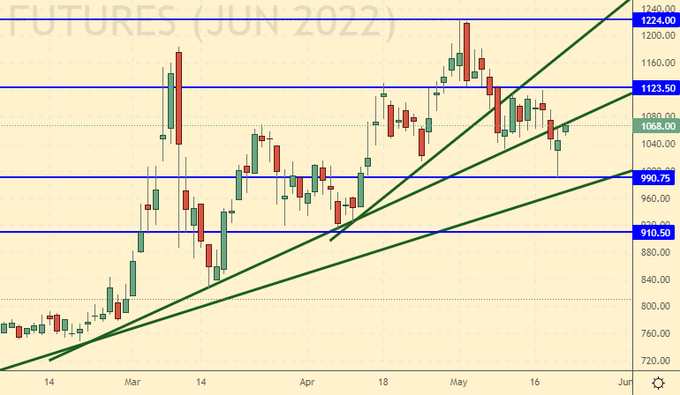
Gas-Oil. ICE
Growth scenario: we consider the June futures, the expiration date is June 10. We won’t be buying this week. The situation is balanced.
Falling scenario: against the backdrop of high oil prices, a deep fall would now look strange. However, a rollback to 800.0 is possible. Recommendation:
Purchase: not yet.
Sale: no. Who is in position from 1150.0, move the stop to 1130.0. Target: 800.0.
Support — 990.75. Resistance is 1123.50.
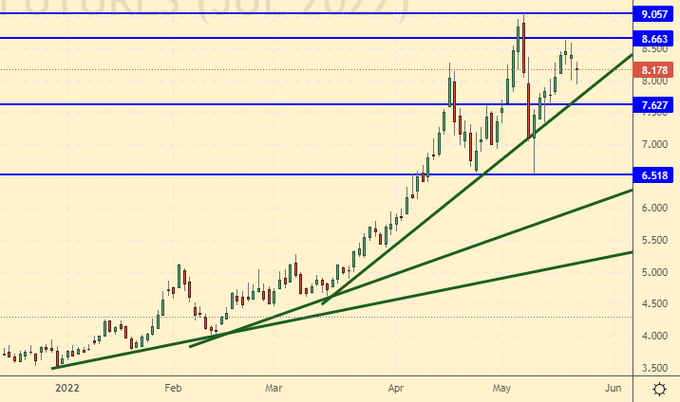
Natural Gas. CME Group
Growth scenario: we are considering the July futures, the expiration date is June 28. We continue to refrain from shopping. It’s not even mid-summer yet to plan for the winter. Prices may drop.
Falling scenario: we continue to believe that it would be interesting to enter short from 10.200. Sales from current levels are possible. Movements in gas in the US are sharp.
Recommendation:
Purchase: no.
Sale: when approaching 10.200. Stop: 11.200. Target: 7.500. Or now. Stop: 8.700. Target: 5.600.
Support — 7.627. Resistance is 8.663.
Wheat No. 2 Soft Red. CME Group
We’re looking at the volume of open interest of wheat managers. You should keep in your mind that these are data from three days ago (for Tuesday of the past week), they are also the most recent of those published by the CME Group.
Over the past week, the difference between long and short positions of managers increased by 15.5 thousand contracts. A solid group of buyers entered the market.
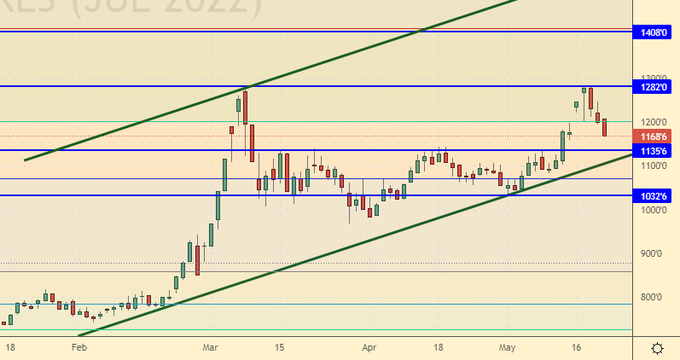
Growth scenario: we consider the July futures, the expiration date is July 14. Growth has stopped, but we continue to be in the ascending channel. We hold longs.
Falling scenario: we will go short after falling below 1050.0. The chances of a correction are good, as fears of grain shortages have subsided significantly.
Recommendation:
Purchase: no. Who is in position from 1060.0, move the stop to 1080.0. Target: 1400.0.
Sale: after falling below 1050.0. Stop: 1140.0. Target: 850.0.
Support — 1144.0. Resistance — 1275.6.
We’re looking at the volume of open interest of corn managers. You should keep in your mind that these are data from three days ago (for Tuesday of the past week), they are also the most recent of those published by the CME Group.
Over the past week, the difference between long and short positions of managers has decreased by one thousand contracts. Sellers enter the corn market for three weeks in a row.
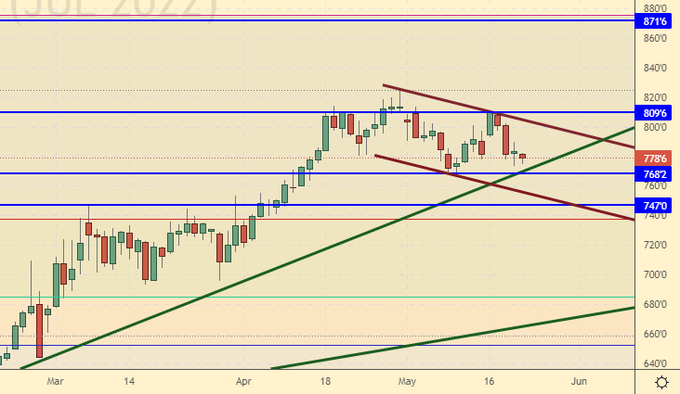
Growth scenario: we consider the July futures, the expiration date is July 14. We are waiting for prices to fall to 700.0. We don’t buy.
Falling scenario: short from current levels is interesting. Selling pressure is intensifying. After falling below 750.0, you can add to the shorts. Recommendation:
Purchase: no.
Sale: now. Stop: 816.0. Target: 700.0. Who is in position from 810.0, keep the stop at 816.0. Target: 700.0 (600.0!).
Support — 768.2. Resistance — 809.6.
Soybeans No. 1. CME Group
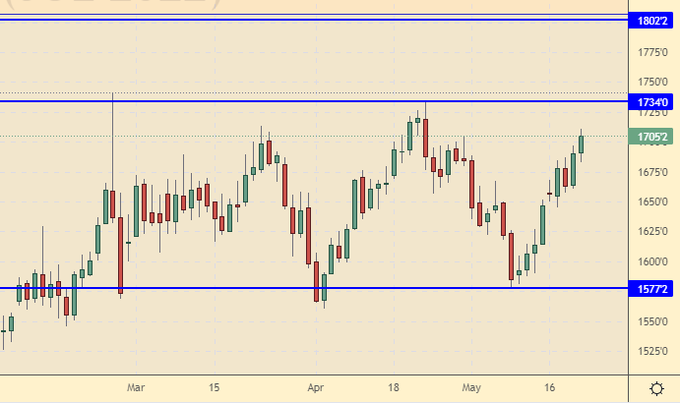
Growth scenario: we consider the July futures, the expiration date is July 14. It is possible that the market will try to test 1800.0. Unfortunately, the current levels are not interesting for purchases. Out of the market.
Falling scenario: if we really get to 1800.0, then shorting is a must. We do not open shorts from current levels.
Recommendation:
Purchase: no.
Sale: when approaching 1800.0. Stop: 1830.0. Target: 1350.0.
Support — 1577.2. Resistance — 1734.0.
Sugar 11 white, ICE
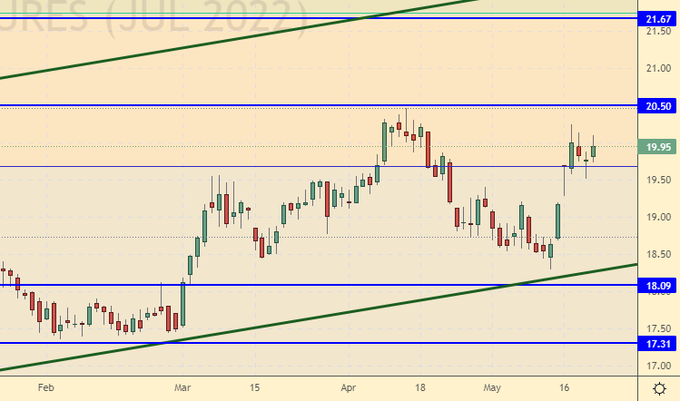
Growth scenario: we are considering the July futures, the expiration date is June 30. We go to 21.60. Stronger growth is not visible yet.
Falling scenario: we continue to believe that shorts from 21.60 are possible. Selling from current levels looks premature.
Recommendation:
Purchase: no. Who is in position from 19.80, move the stop to 19.00. Target: 21.60.
Sale: no.
Support — 18.09. Resistance is 20.50.
Сoffee С, ICE
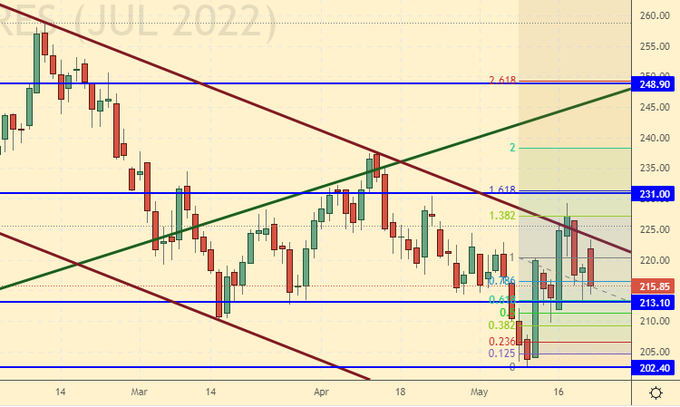
Growth scenario: we are considering the July futures, the expiration date is July 19. The picture is nervous, but we will continue to keep longs. Moreover, those who wish can buy here.
Falling scenario: for the time being, we will refrain from selling. If the market drops below 210.0, we will think about going short again.
Recommendation:
Purchase: now. Stop: 207.00. Target: 248.00. Who is in position from 211.0, keep the stop at 207.00. Target: 248.00.
Sale: no.
Support — 213.10. Resistance is 231.00.
Gold. CME Group
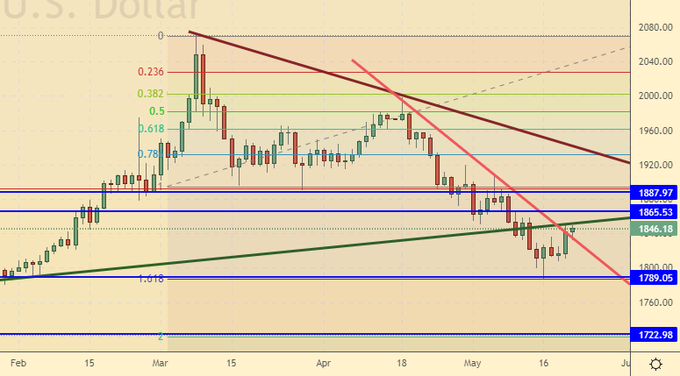
Growth scenario: current upswing does not look aggressive. Most likely sellers will meet from 1860 and from 1890. We do not buy.
Falling scenario: holding shorts. If there is a blow in 1890 it can be sold.
Recommendations:
Purchase: when approaching 1740. Stop: 1720. Target: 2300!
Sale: approaching 1890. Stop: 1920. Target: 1740. Whoever is in the position from 1930, keep the stop at 1860. Target: 1740.
Support — 1789. Resistance — 1865.
EUR/USD
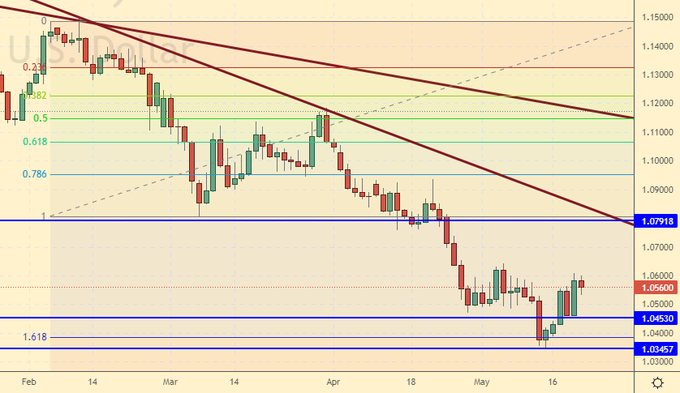
Growth scenario: chances are good to reach 1.0700, moving higher requires higher expectations of ECB rate hike on June 9th. If the ECB maintains a weak monetary policy, the pair will fall to parity.
Falling scenario: we will sell when we return to the area of 1.1000, not lower.
Recommendations:
Purchase: no. Who is in position from 1.0430, move the stop to 1.0420. Target: 1.1000.
Sale: no.
Support — 1.0453. Resistance is 1.0791.
USD/RUB
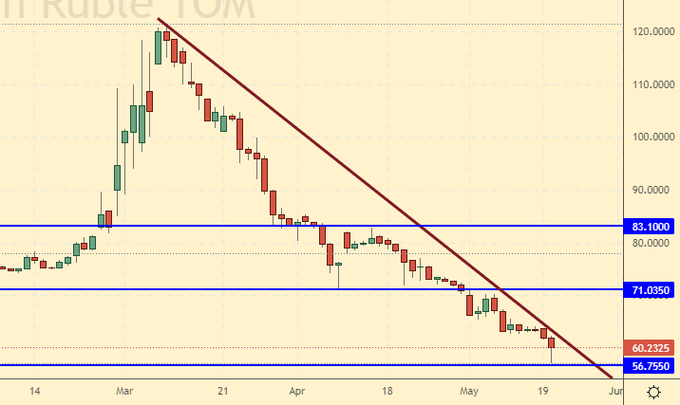
Growth scenario: if the pair draws a green candle next week with a close above 65.00, then it will be possible to buy. The chances of growth are still small, but everything can change, provided that the Central Bank continues to gradually remove regulation.
Falling scenario: we continue to refrain from selling. The current course is already unnerving the government. At the moment, budget revenues are at a good level, but they will clearly decrease by the end of the year.
Recommendations:
Purchase: after a green candle with a close above 65.00. Stop: 63.40. Target: 100.00! Also, think when touching the 53.00 level.
Sale: no.
Support — 56.75. Resistance — 71.03.
RTSI
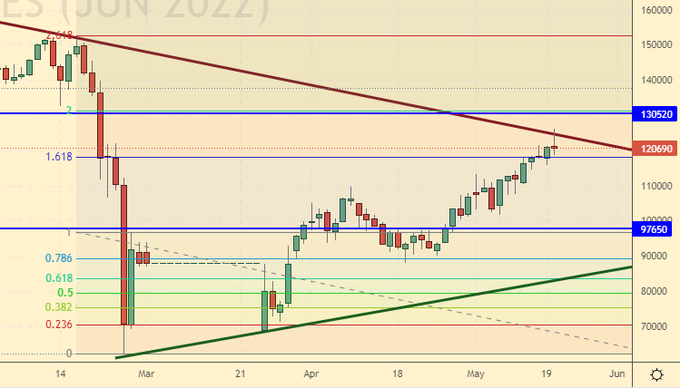
Growth scenario: the Russian stock market tried to grow on the expectations of dividends from Gazprom. But the company is unlikely to give investors as much as 50 rubles per share, as ordinary people expect. And 10 rubles is enough. The Board of Directors will be held on May 26th. We don’t believe in growth. Out of the market.
Falling scenario: the market touched 126000, it was possible to sell there. Shorts from 130,000 would be ideal. It is possible that we will reach this mark next week.
Recommendations:
Purchase: no. Close all positions.
Sale: when approaching 130000. Stop: 136000. Target: 80000 (50000). Who is in position from 126000, move the stop to 127000. Target: 80000 (50000).
Support — 97650. Resistance — 130520.
The recommendations in this article are NOT a direct guide for speculators and investors. All ideas and options for working on the markets presented in this material do NOT have 100% probability of execution in the future. The site does not take any responsibility for the results of deals.


