Price forecast from 19 to 23 of April 2021
-
Energy market:
In almost five years of the release of weekly forecasts, we rarely dig in the dirt, that is, in politics, but the events of the past week are hard to ignore.
After being invited to negotiate, the next day, Biden spat in the face, that is, imposed sanctions, including a ban on buying new issues of the Russian national debt. What a real gentleman!
And now, on the weekend, after the Kremlin’s retaliatory measures, we are already talking about a ban on the purchase of Russian debt securities on the secondary market by American companies, which, if applied, would be an extremely unpleasant step.
And what does oil have to do with it? It cannot be ruled out that a blow to the Russian economy is another tool that can be applied sooner or later, provided that the Kremlin and the White House cannot start normal communication.
In the current situation, a drop in oil prices can be organized at any time, simply by unleashing the horrors of a pandemic in the information field. But on a longer horizon, to keep quotes at a low level, the assistance of the states of the Arabian Peninsula will be required, but there is a problem, they themselves will not last a couple of years with low oil prices. Therefore, we can accept a short-term fall as a working hypothesis, but a long stay quotes below $ 40 per barrel, no.
In theory, the oil market is able to go up from the current levels of the order of 10 — 12%, on the positive from the results of the first quarter, but further ascent is hardly possible without a long-term correction. Thus, even without artificial pressure on prices, by the end of the second quarter, we are likely to get price levels slightly above $ 50 per barrel.
Grain market:
Both wheat and corn continue to be at local highs without giving any serious signs of a downward reversal. It’s more than three weeks before he USDA May report for the 21\21 season. During this time, speculators can raise the market a little more, however, the good situation with winter crops will restrain this growth.
Pay attention to the spread between wheat and corn, which is at the level of 70 cents per bushel, which is somewhat narrower than the average 100 cents, which is usually more expensive than corn.
Evaluating the technical picture, we can assume that corn will lose some value next week, while wheat will continue to remain in the current area.
The spring exacerbation between Washington and Moscow, in the form of an exchange of sanctions, is unlikely to have a strong impact on the grain market, provided that logistical significant objects are not affected in the process of confrontation: ports, straits, locks, railway stations.
USD/RUB:
Russia’s GDP growth in the first quarter amounted to 0.8 — 0.9%. At the moment, by the end of the year, one can expect economic growth of 3%. We assume that after intensive growth in the first quarter, growth in the next months will slow down.
However, a positive development of events will continue to be possible only if relative stability in foreign policy is maintained. In the event of tougher sanctions and a simultaneous fall in oil prices, there will be no need to wait for economic growth by the end of the year.
The ruble is currently in an extremely vulnerable position due to growing tensions between Russia and the United States. The Central Bank will meet on Friday for a meeting. It cannot be ruled out that due to external pressure from Washington, the rate will again be raised by 0.25%, however, while Nabiullina can limit herself to only verbal interventions. Note that the situation has been changing extremely rapidly in recent days. We urge you to keep track of the information background.
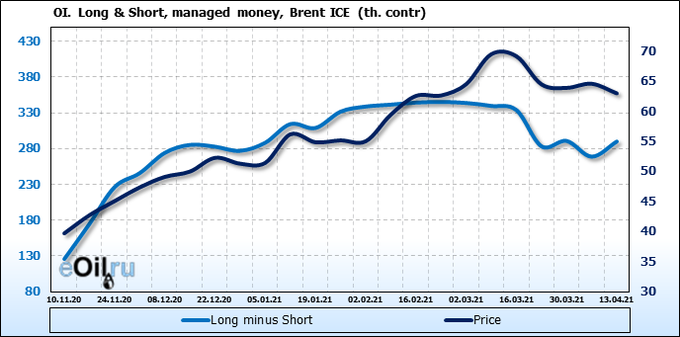
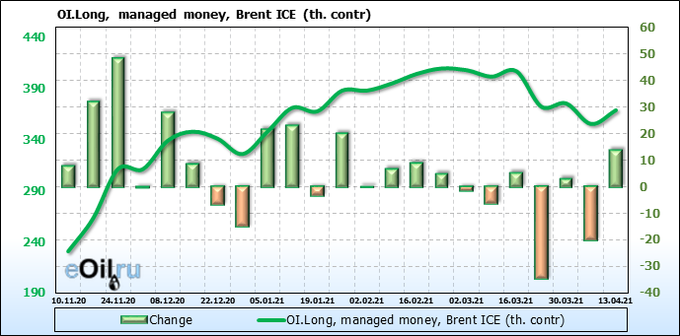
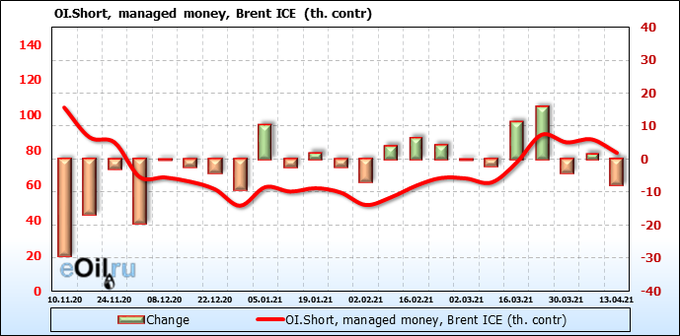
We’re looking at the volume of open interest of managers. You should keep in your mind that these are data from three days ago (for Tuesday of the past week), they are also the most recent of those published by the ICE exchange.
The bulls returned to the market last week. They managed to slightly raise the quotes, but there is no reversal in the market so far, which creates a temptation for sellers to launch another attack. Growth scenario: April futures, the expiration date is April 30. Let’s continue to interpret the current situation in favor of sellers, we don’t buy.
Falling scenario: the situation is very beautiful from the point of view of considering opportunities for entering a short. However, a downward reversal signal is needed.
Recommendation:
Purchase: no.
Sale: if a red day appears with a close below 69.00, sell. Stop: above the high of this red day. Target: 53.60.
Support — 64.24. Resistance — 67.33.
WTI. CME Group
Fundamental US data: the number of active drilling rigs increased by 7 to 344.
US commercial oil reserves fell by -5.89 to 492.423 million barrels. Gasoline inventories rose by 0.309 to 234.897 million barrels. Distillate stocks fell -2.083 to 143.464 million barrels. Inventories at the Cushing storage facility rose 0.346 to 46.668 million barrels.
Oil production increased by 0.1 to 11 million barrels per day. Oil imports fell by -0.412 to 5.852 million barrels per day. Oil exports fell by -0.855 to 2.579 million barrels per day. Thus, net oil imports rose by 0.443 to 3.273 million barrels per day. Oil refining increased by 1 to 85 percent.
Gasoline demand rose by 0.163 to 8.944 million barrels per day. Gasoline production rose 0.336 to 9.615 million barrels per day. Gasoline imports fell by -0.458 to 0.839 million barrels per day. Gasoline exports fell by -0.129 to 0.663 million barrels per day.
Distillate demand rose 0.464 to 4.128 million barrels. Distillate production rose 0.004 to 4.643 million barrels. Distillate imports fell by -0.064 to 0.261 million barrels. Distillate exports fell by -0.018 to 1.074 million barrels per day. The demand for petroleum products increased by 1.092 to 20.328 million barrels.
Production of petroleum products increased by 1.43 to 21.35919 million barrels. Imports of petroleum products fell by -0.107 to 2.448 million barrels. Exports of petroleum products rose by 0.316 to 5.061 million barrels per day.
Propane demand fell by -0.547 to 1.112 million barrels. Propane production rose 0.004 to 2.289 million barrels. Propane imports fell by -0.003 to 0.13 million barrels. Propane exports rose 0.448 to 1.161 million barrels per day.
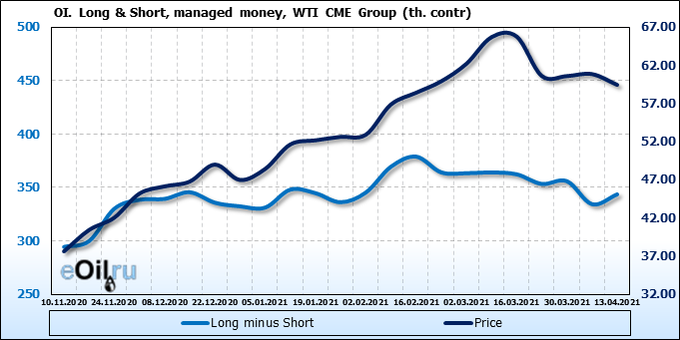
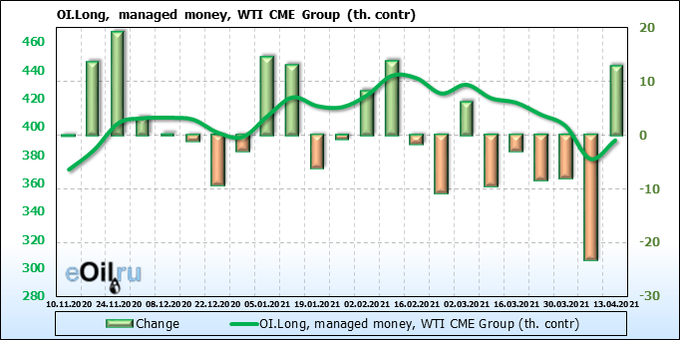
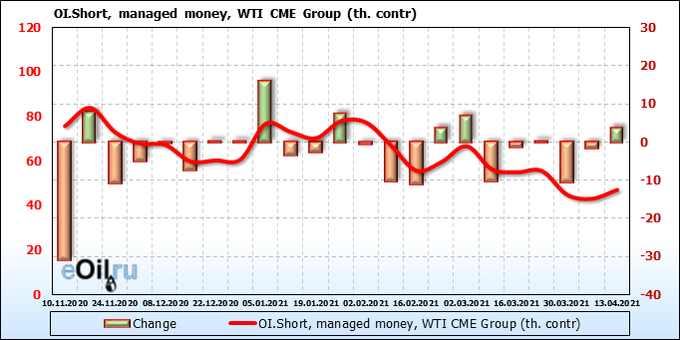
We’re looking at the volume of open interest of managers. You should keep in your mind that these are data from three days ago (for Tuesday of the past week), they are also the most recent of those published by the CME Group.
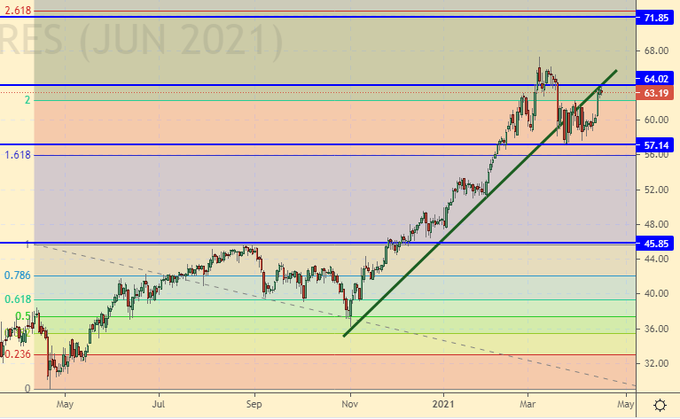
The buyers are back. The attack went up with the intention to break next week stop-orders above 68.00 and go to 71.80. But there are a handful of brave men who oppose these plans. We note a technically interesting situation for the short.
Growth scenario: June futures, expiration date May 20. In case of growth above 65.00, you can buy at 1H intervals with targets at 71.80. We do not recommend making purchases on daily intervals.
Falling scenario: «you can sell with a breakthrough to 64.00» we wrote a week earlier. We will amend this recommendation. Need a red day down with a candle body of at least 80 cents. Until he is gone, we are not selling.
Recommendation:
Purchase: no.
Sale: when a red day occurs with a close below 64.20. Stop above the high of such a day. Target: 46.00. Those who are in positions between 61.00 and 61.50, move the stop to 65.20. Target: 46.00.
Support — 57.14. Resistance — 64.02 (71.85).
Gas-Oil. ICE
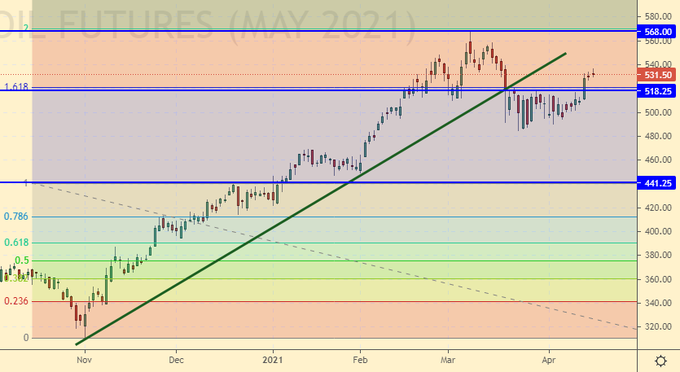
Growth scenario: May futures, the expiration date is May 12. We continue to wait for the market to fall. We do not buy.
Falling scenario: sell here. Let’s note an almost ideal situation for a short. Downward impulse and completed correction to it.
Recommendation:
Purchase: no.
Sale: now and up to 536.0. Stop: 543.0. Target: 410.0. Whoever is in positions between 530.0, 520.0, 515.0 and 510.0, keep the stop at 543.0. Target: 410.0.
Support — 518.25. Resistance — 568.00.
Natural Gas. CME Group
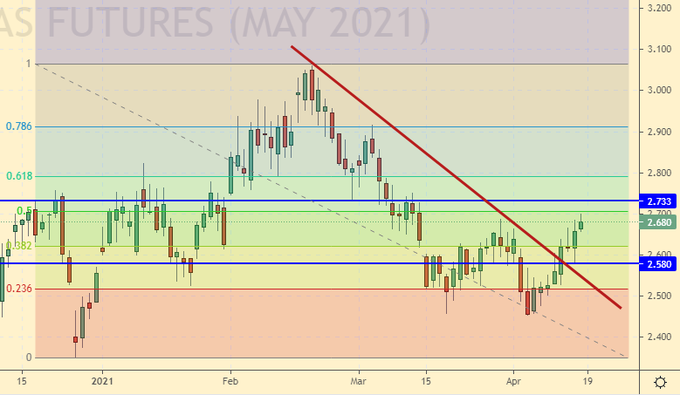
Growth scenario: May futures, expiration date April 28. We will keep the longs opened earlier. Europe should ensure good gas demand this summer. They are afraid of winter. «Game of Thrones» is proof of this.
Falling scenario: don’t sell yet.
Recommendation:
Purchase: no. Those who are in the position from 2.52, move the stop to 2.54. Target: 3.615.
Sale: no.
Support — 2.580. Resistance — 2.733.
Wheat No. 2 Soft Red. CME Group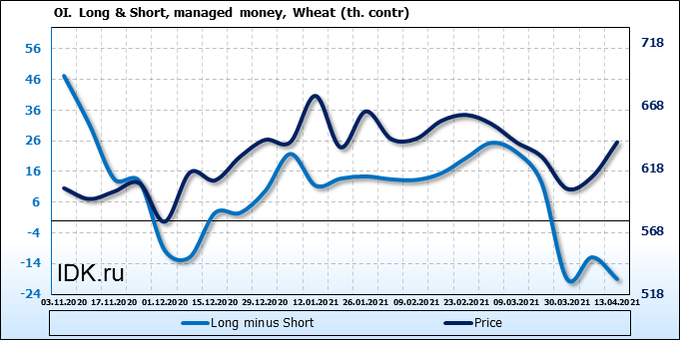
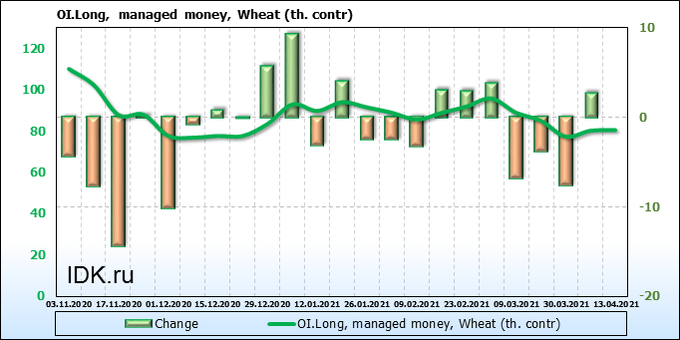

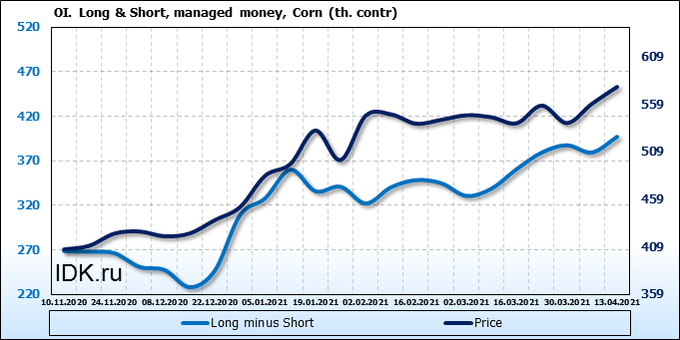
We’re looking at the volume of open interest of managers. You should keep in your mind that these are data from three days ago (for Tuesday of the past week), they are also the most recent of those published by the CME Group.
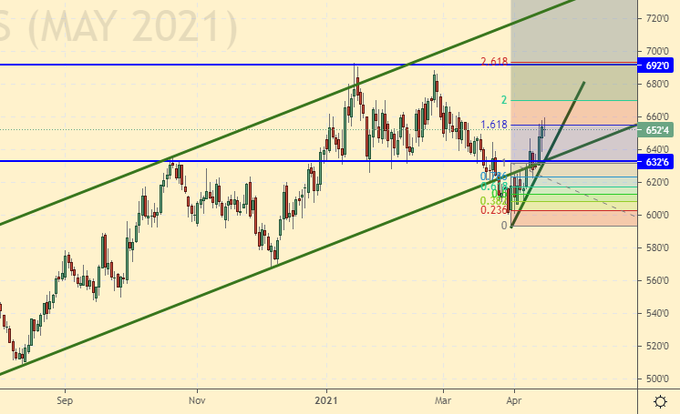
The number of sellers has increased. Despite this, the market continues to rise. If the discrepancy between the open interest and the price persists next week, then after the rise to 692.0 one can expect a sharp drop in prices.
Growth scenario: May futures, expiration date May 14. Our purchases since the beginning of last week have survived. Okay. We will keep. Let’s see what will happen next. Suddenly we went to 800.0.
Falling scenario: we will not sell yet. However, if the market falls below 630.0, you can sell.
Recommendation:
Purchase: no. Those who are in the position from 622.0, move the stop to 624.0. Target: 800.0.
Sale: on touch 628.0. Stop: 646.0. Target: 560.0.
Support — 632.6. Resistance — 692.0.
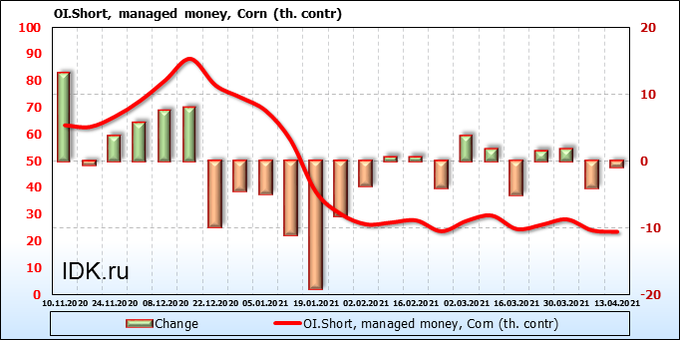
We’re looking at the volume of open interest of managers. You should keep in your mind that these are data from three days ago (for Tuesday of the past week), they are also the most recent of those published by the CME Group.
Bulls with a standard volume of 18 thousand contracts entered the market, but we do not see any significant consequences of this entry. Prices have approached a technically strong resistance level and it will not be easy to break above it.
Growth scenario: May futures, expiration date May 14. A pass above 610.0 could lead to a sharp rise in prices. We do not expect this event to happen before July.
Falling scenario: sell here. This is a rare event — reaching the 2.618% Fibonacci level on the daily timeframe.
Recommendation:
Purchase: not yet.
Sale: now and up to 616.0. Stop: 616.0. Target: 510.0. Consider the risks !!!
Support — 572.0. Resistance — 603.2.
Soybeans No. 1. CME Group
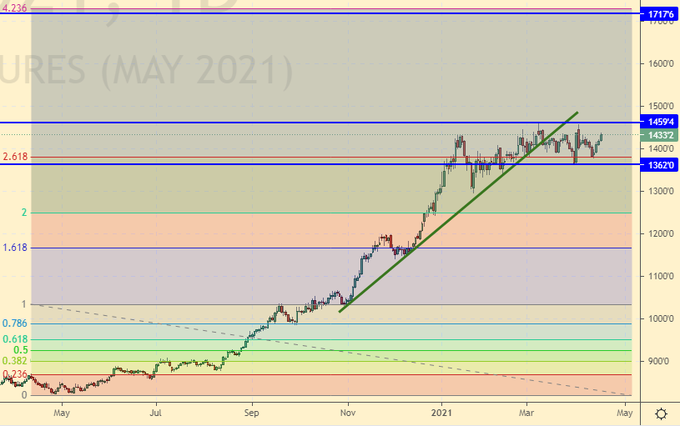
Growth scenario: May futures, expiration date May 14. As before, we believe that it makes sense to buy after the growth above 1470.0. There is a chance that soybeans will reach 1720.0.
Falling scenario: sellers failed. It was not possible to keep the market below 1380. We do not open new positions.
Recommendation:
Purchase: after rising above 1470.0. Stop: 1410. Target: 1720.0.
Sale: after falling below 1370.0. Stop: 1426.0. Target: 1180.0. Whoever is in the position from 1380.0, keep the stop at 1436.0. Target: 1180.0.
Support — 1362.0. Resistance — 1459.4.
Sugar 11 white, ICE
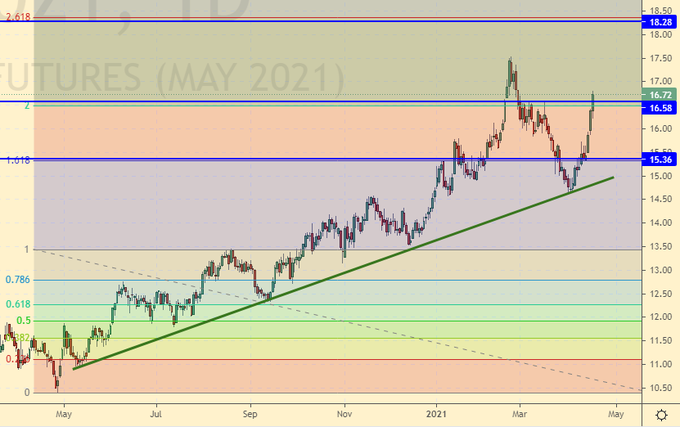
Growth scenario: May futures, the expiration date is April 30. The purchase from 14.60 turned out to be extremely successful in terms of reward / risk ratio. We keep long. We are waiting for arrival at 18.20.
Falling scenario: the short from 18.20 continues to be the main idea. As if the prices of all foodstuffs did not rise simultaneously by another twenty percent.
Recommendation:
Purchase: no. whoever is in the position from 14.60, move the stop to 15.40. Target: 18.20.
Sale: only when approaching the area at 18.20. Stop: 18.60. Target: 16.60.
Support — 16.58. Resistance — 18.28.
Сoffee С, ICE
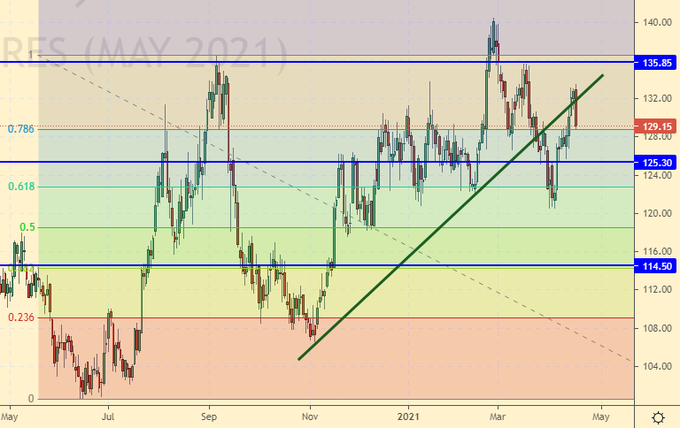
Growth scenario: May futures, the expiration date is May 18. Long is not obvious. Only a return above 135.00 will make us buy.
Falling scenario: the picture is uncertain. The red candle on Friday gives a small chance of falling.
Recommendation:
Purchase: on touch 115.20. Stop: 113.80. Target: 157.00. Or think after a rise above 135.00.
Sale: now. Stop: 135.30. Target: 115.20.
Support — 125.30. Resistance — 135.85.
Gold. CME Group
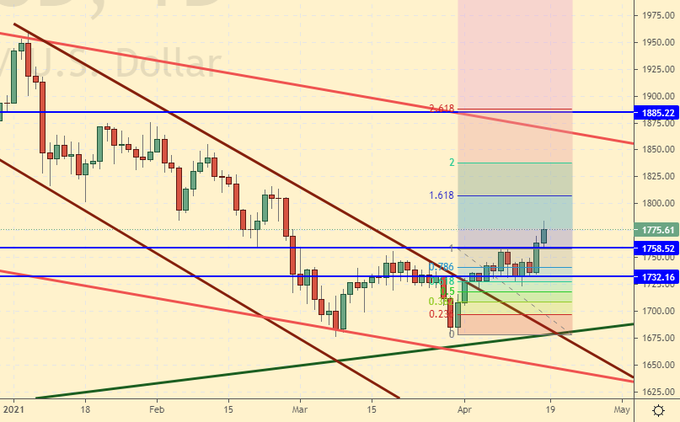
Growth scenario: «We will buy only after the day closes above 1760», we wrote a week earlier. The event has come. You must be in longs. We keep it.
Falling scenario: it’s better to leave the shorts here. It is possible that psychoses in Washington are caused by some setbacks, about which we do not know anything.
Recommendations:
Purchase: no. Anyone in the position from 1760, move the stop to 1744. Target: 1885 (revised).
Sale: no.
Support — 1758. Resistance — 1885.
EUR/USD
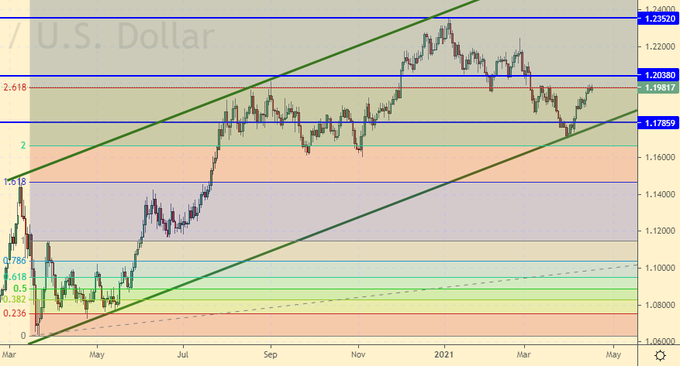
Growth scenario: is that so? We will look at 1.2800? It is very interesting. We look forward to growth above 1.2050 and buy.
Falling scenario: the growth of the pair amid the raging pandemic in Europe can only be explained by the loss of confidence in the dollar. No matter how much the Chinese comrades had a hand in this question. In the meantime, you can sell after the appearance of the red candlestick down.
Recommendations:
Purchase: after rising above 1.2050. Stop: 1.1870. Target: 1.2800.
Sale: after a long red candle appears with a close below 1.2000. Stop: 1.2030. Target: 1.1200.
Support — 1.1785. Resistance — 1.2038.
USD/RUB
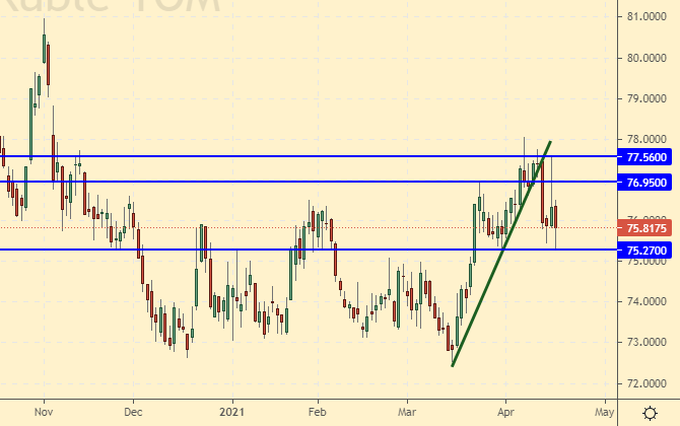
Growth scenario: last week the ruble experienced both the love of the inexperienced investment masses, and shock, and awe, and it looks like the intervention of the Central Bank, which took place after the announcement of the introduction of new sanctions by the United States. Conflicting with an economy that can print Russia’s annual GDP in its currency and the rest of the world accepts is not the best thing to do. We buy a dollar.
Falling scenario: hardly any of the speculators will bet on the strengthening of the ruble in the current situation. It is necessary for Biden to calm down, but this is not happening yet. We do not consider a dollar short as a working idea.
Purchase: now. Stop: 74.80. Target: 80.00.
Sale: no.
Support — 75.27. Resistance — 76.95.
RTSI
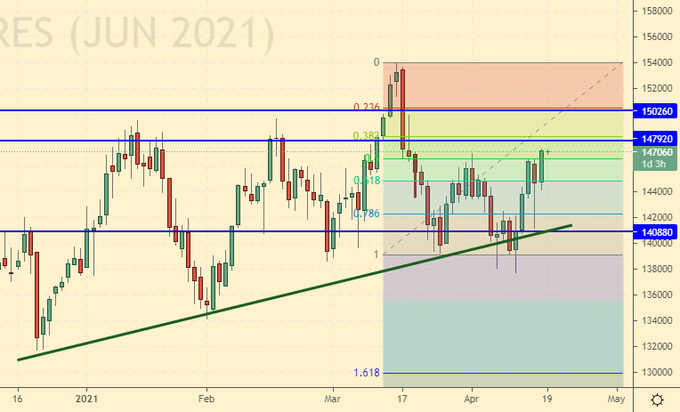
Growth Scenario: too much negative stuff from Washington. In addition, the US stock market is ripe for a full fall. Among other things, Bitcoin fell. Except for oil prices, the background is negative, we will not buy.
Falling scenario: if Moscow does not take a step back in its confrontation with the American Democrats, of course, provided that such a step can still be taken, and continues a tough exchange of blows, then sooner or later the economy will begin to suffer. In the current circumstances, we do not believe in the growth of the stock market.
Recommendations:
Purchase: no.
Sale: when a long red daily candle appears with a close below 150,000, sell. Stop above the high of this candlestick. Target: 100,000.
Support — 140880. Resistance — 147920.
The recommendations in this article are NOT a direct guide for speculators and investors. All ideas and options for working on the markets presented in this material do NOT have 100% probability of execution in the future. The site does not take any responsibility for the results of deals.

