18 January 2021, 11:43
PRICE FORECAST from 18 to 22 of January 2021
-
Energy market:
The week ended in the red zone. Amid the strengthening of the dollar, the commodity market went down along the entire front. Oil has lost 3.5% of its value in the last three days.
The fall of the SP500 index draws attention. So far, only 1% during Friday, however, if the trend accelerates, the commodity group will suffer from worsening investor sentiment in the stock market.
Biden’s inauguration comes amid his promises to boost the economy by an additional $ 1.9 trillion. dollars. Note that one trillion of this money will be received directly by US citizens.
The main intrigue here lies in inflation in the United States. 27th Fed meeting will be held. Let’s see what the meeting participants have to say about the risk of an inflationary spiral. As soon as Powell says something like: «We are closely monitoring inflation statistics», traders will be enough to «kill» the stock market. And oil will suffer along with the stock market.
Grain market:
Egypt did not buy expensive Russian wheat, since its cost became higher than the cost of competitors from France and Canada due to the export duty imposed in Russia in the amount of 25 euros per ton. Russia’s imposition of export restrictions will no doubt support the global market.
The USDA reports that its forecast for US corn production in 2020/21 has been lowered to 14,182 million bushels, primarily due to a decline in the national average yield from 175.8 to 172.0 bushels per acre. Opening balances have also been reduced, bringing the total projected inventory down 400 million bushels from the previous month. The projected average farm price has been raised from 400 cents to 420 cents per bushel due to more limited supply prospects.
In this situation, one should not be surprised by the continuing rally in the corn market. The chances of hitting the 560.0 cents per bushel area on the Chicago stock exchange remain, although they are slightly reduced due to the strengthening of the US dollar at the end of last week.
USD/RUB:
The RGBI Russian debt index is feeling worse every day. Friday turned out to be disgusting on the Russian debt market. If on Monday investors’ interest in Russian securities continues to fall, the ruble will hardly be able to claim to strengthen against the dollar below 73.00.
The oil giving signals of a downward reversal can add fuel to the fire. Even if the global upward trend in the oil market does not suffer, we can still see prices fall by 10-15%, which will strengthen negative expectations for the ruble against the dollar. The chances of a reversal in the dollar / ruble pair are growing up.
Brent. ICE
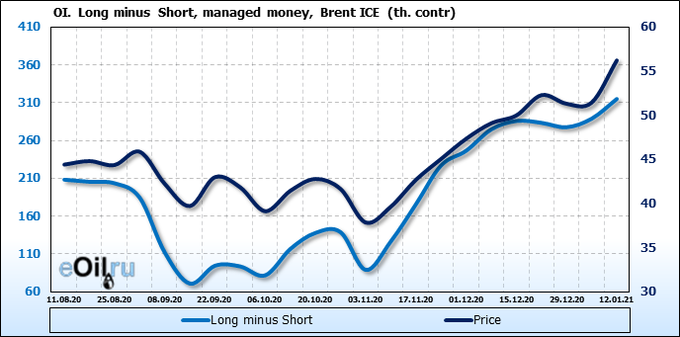
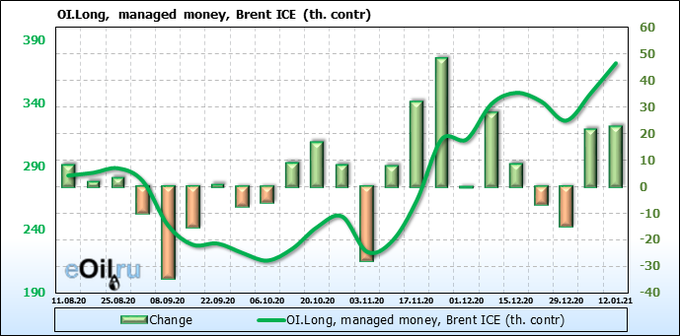
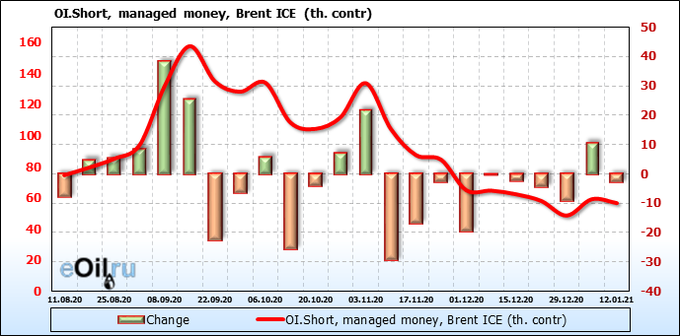
We’re looking at the volume of open interest of managers. You should keep in your mind that these are data from three days ago (for Tuesday of the past week), they are also the most recent of those published by the ICE exchange.
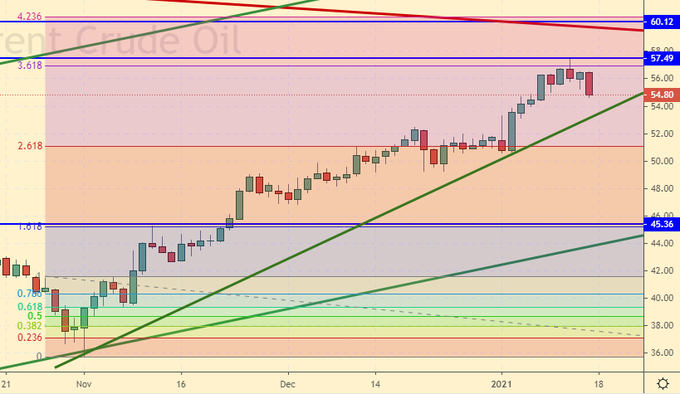
The bulls started the year actively and in the medium term we cannot say that the market is going to turn down. Speculators must start investing in shorts to talk about a trend reversal. Growth scenario: there is no point in buying at current levels. We need a rollback. Friday turned out to be red, which gives us the right to speculate about a possible fall to 46.00. Falling scenario: here you can try to sell. The bulls were not allowed in at 60.00. Failure to reach the main target at the Fibonacci level is an early signal for a trend change.
Recommendation:
Purchase: look for opportunities in the fall to 46.00. Sale: now. Stop: 57.60. Target: 46.00.
Support — 45.36. Resistance — 57.49.
WTI. CME Group
Fundamental US data: the number of active drilling rigs increased by 12 units to 287 units.
US commercial oil reserves fell by -3.248 to 482.211 million barrels. Gasoline inventories rose by 4,395 to 245,476 million barrels. Distillate stocks rose by 4.786 to 163.205 million barrels. Cushing’s stocks fell -1.975 to 57.227 million barrels.
Oil production has not changed at 11 million barrels per day. Oil imports rose 0.87 to 6.239 million barrels per day. Oil exports fell by -0.621 to 3.011 million barrels per day. Thus, net oil imports rose by 1.491 to 3.228 million barrels per day. Oil refining rose by 1.3 to 82 percent.
Gasoline demand rose 0.091 to 7.532 million barrels per day. Gasoline production fell by -0.498 to 7.512 million barrels per day. Gasoline imports fell by -0.062 to 0.383 million barrels per day. Gasoline exports fell by -0.285 to 0.598 million barrels per day.
Distillate demand rose 0.668 to 3.609 million barrels. Distillate production fell by -0.124 to 4.661 million barrels. Distillate imports rose 0.044 to 0.346 million barrels. Distillate exports fell by -0.518 to 0.714 million barrels per day.
The demand for petroleum products increased by 2,553 to 19.607 million barrels. The production of oil products increased by 0.222 to 19.311238 million barrels. Imports of petroleum products rose by 0.254 to 1.787 million barrels. Exports of refined products rose 0.262 to 5.129 million barrels per day.
Propane demand rose by 0.402 to 2.104 million barrels. Propane production rose 0.083 to 2.34 million barrels. Propane imports fell by -0.032 to 0.149 million barrels. Propane exports rose 0.272 to 1.347 million barrels per day.
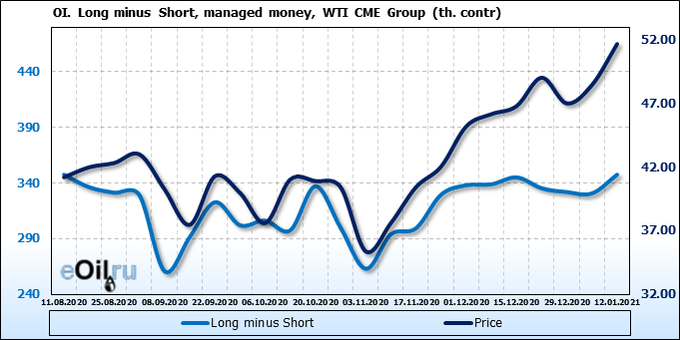
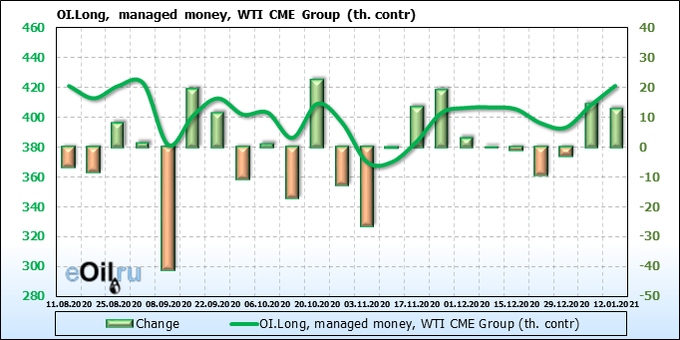
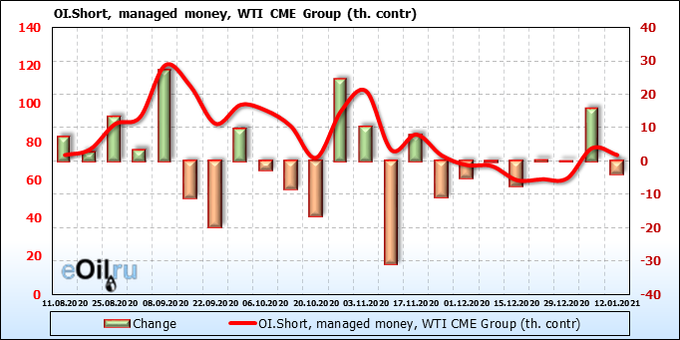
We’re looking at the volume of open interest of managers. You should keep in your mind that these are data from three days ago (for Tuesday of the past week), they are also the most recent of those published by the CME Group.
The bulls are more active at the beginning of the year. However, the sales of 17 thousand contracts at the beginning of the year attract attention. If the one who sold in early January is strong enough, he will defend his position in the current situation. Correction is possible.
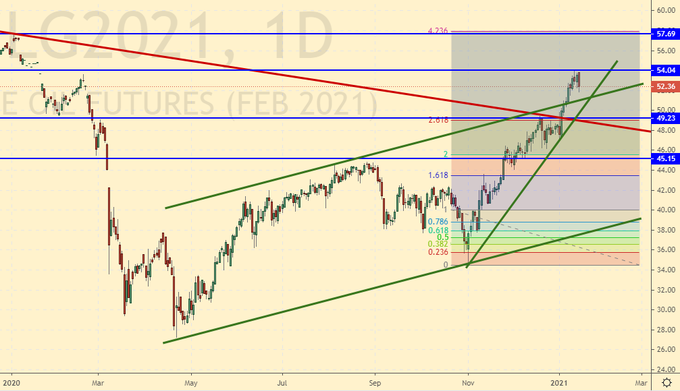
Growth scenario: we could not go up the 55.00 area, which creates preconditions for a downward correction. We can count on a pullback to 46.00.
Falling scenario: “If a struggle starts around 55.00, then we can look for opportunities for sales,” we wrote a week earlier. And there is. A long red candle appeared on Friday. You can sell.
Recommendation:
Purchase: no. A correction is needed, at least to the area of 46.00.
Sale: now. Stop: 54.14. Target: 46.00.
Support — 49.23. Resistance — 54.04.
Gas-Oil. ICE
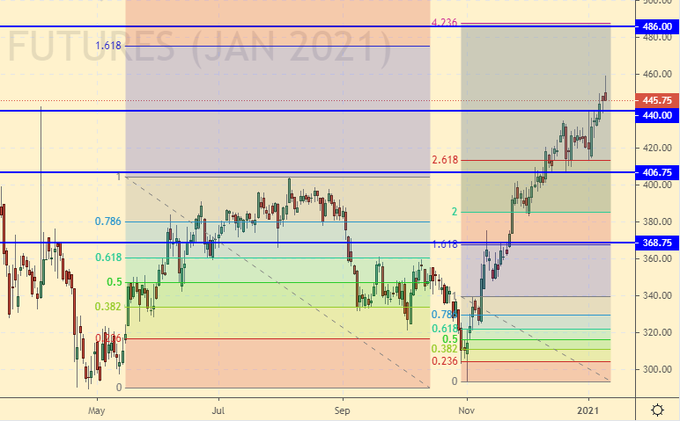
Growth scenario: current levels are clearly overstated for purchases. Due to quarantine measures, fuel consumption in the US and Europe has decreased. We are waiting for a rollback.
Falling scenario: waiting for a fall below 440.0 and looking for opportunities to enter the short. A lot will depend on the mood with which the exchanges will open on Monday.
Recommendation:
Purchase: no. Wait for a rollback to 370.0.
Sale: no. Think when falling below 440.0. Consider the risks.
Support — 440.00. Resistance — 486.00.
Natural Gas. CME Group
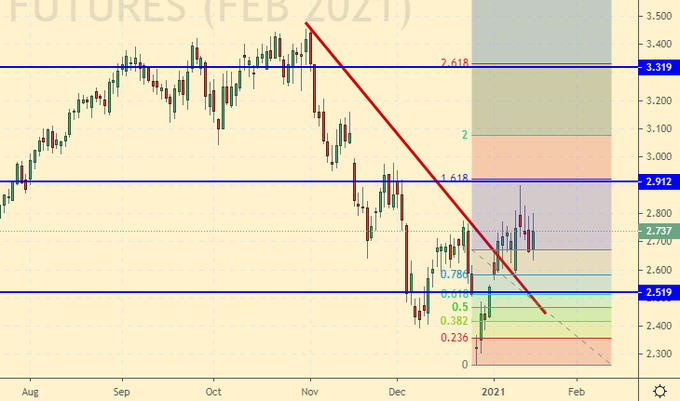
Growth scenario: the whole of Europe has been actively freezing since the beginning of January, what will support the market for several weeks. We keep longs, build up positions.
Falling scenario: sales are out of the question when it is snowing in southern Spain and Poland is expecting -20 Celsius.
Recommendation:
Purchase: now. Stop: 2.390. Target: 4.775. Those who are in the position from 2.600, move the stop to 2.390. Target: 4.775.
Sale: no.
Support — 2.519. Resistance — 2.912.
Wheat No. 2 Soft Red. CME Group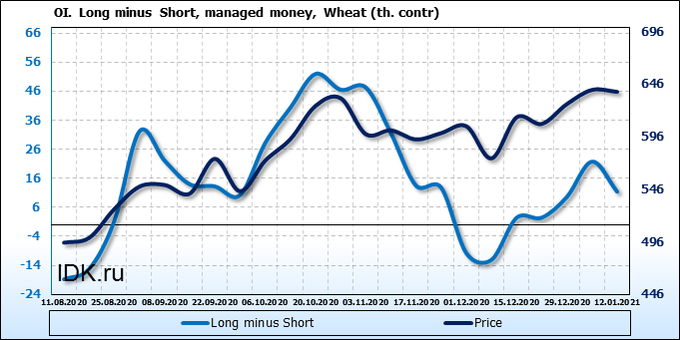
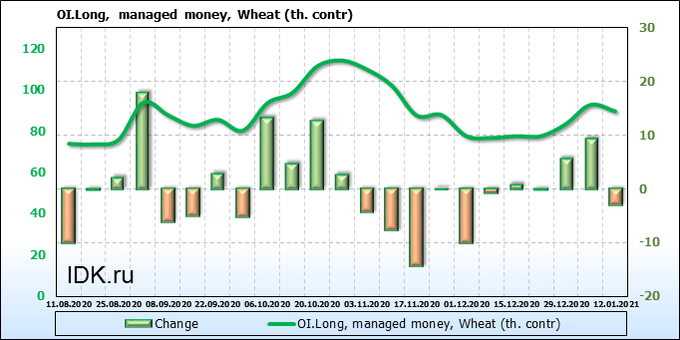
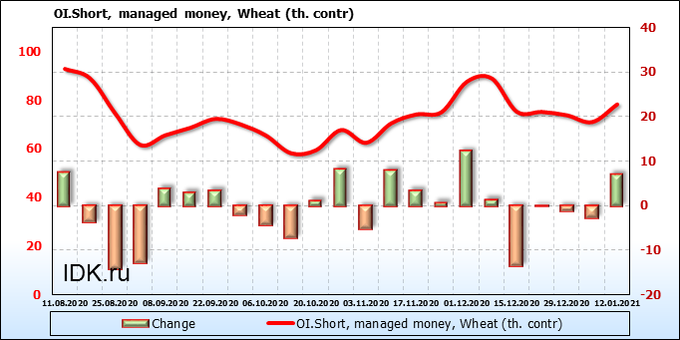
We’re looking at the volume of open interest of managers. You should keep in your mind that these are data from three days ago (for Tuesday of the past week), they are also the most recent of those published by the CME Group.
We see that the bulls wavered, while the sellers decided to go on the attack. We can assume that as it rises to the 710.0 area, the pressure from sellers will grow.
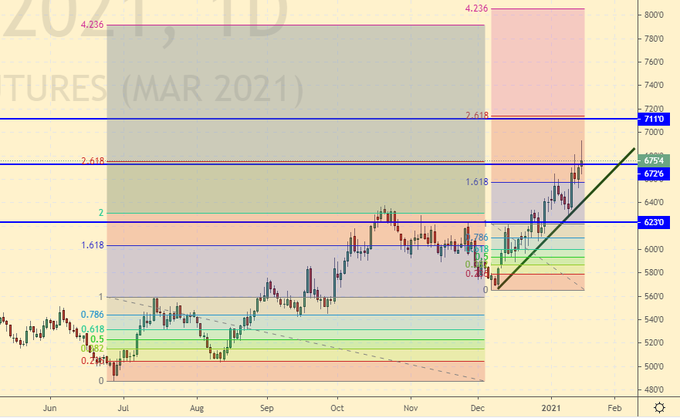
Growth scenario: we will not buy. There is a possibility that the upward momentum is completed, which means the beginning of a correctional stage, which could last a couple of months.
Falling scenario: we will continue to recommend selling. The market has grown significantly over the past six months, which gives us the right to expect a pullback to 560.0.
Recommendation:
Purchase: no. We look forward to a fall to 560.0.
Sale: now. Stop: 690.0. Target: 560.0.
Support — 623.0. Resistance — 711.0.
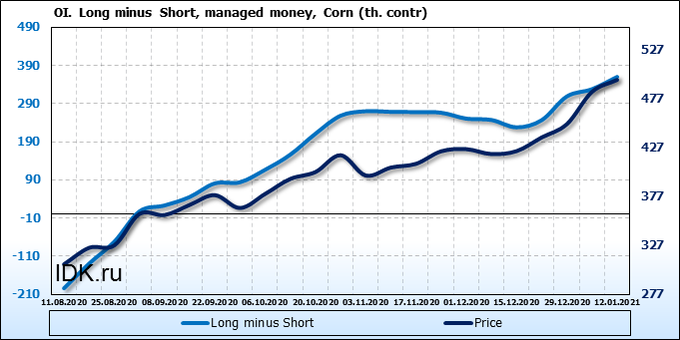
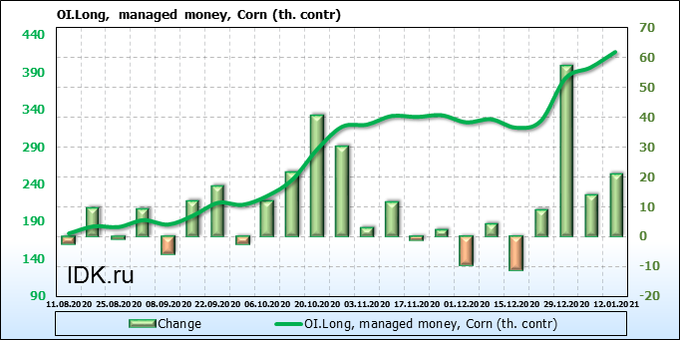
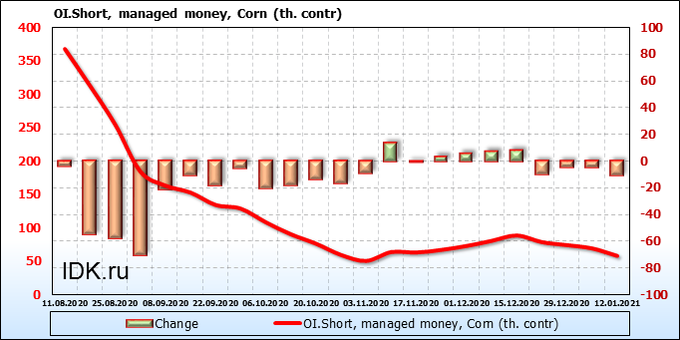
We’re looking at the volume of open interest of managers. You should keep in your mind that these are data from three days ago (for Tuesday of the past week), they are also the most recent of those published by the CME Group.
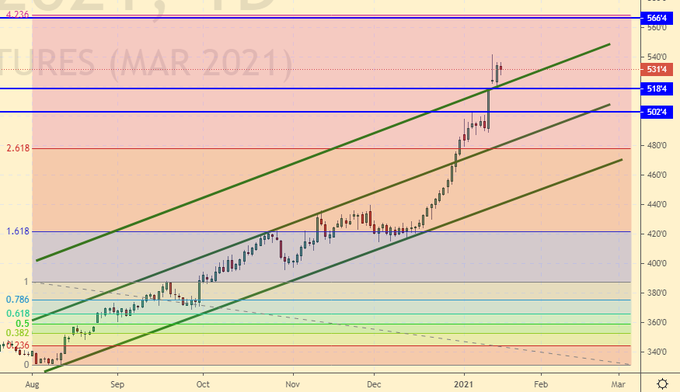
Buyers are simply breaking the market. The pressure is colossal as the demand for corn remains high. It is possible that we will go up to 560.0, but this is extremely likely that everything will end. Note that there is no one on the market right now who believes in a downward reversal.
Growth scenario: we will not buy. Prices are high. Most likely we will hit 566.0 and roll back. Downgraded forecasts for gross corn harvest in the US may contribute to this move up.
Falling scenario: we need a long red candlestick down. But she is not. If so, it is still out of the market.
Recommendation:
Purchase: no. Need a rollback.
Sale: possible when a long red daily candle appears. When you touch 559.0, sell is mandatory. Stop: 576.0. Target: 460.0.
Support — 518.4. Resistance — 566.4.
Soybeans No. 1. CME Group
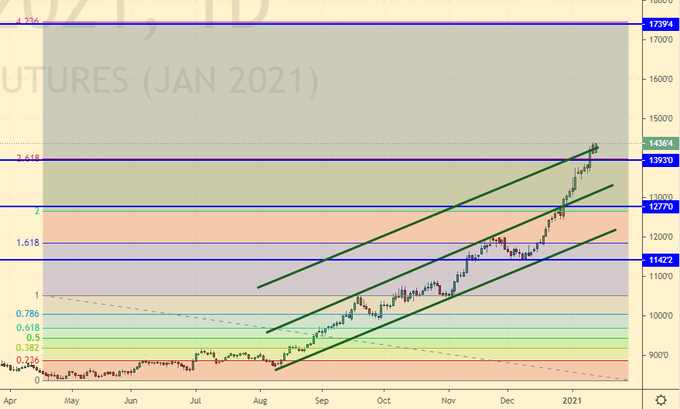
Growth scenario: we have consolidated above 1390.0, having broken above the next Fibonacci level. There is a chance of a move to 1740.0. But, reluctantly, we will not enter the long. Need a rollback.
Falling scenario: there is nothing to think about here, when a red long candle appears, we enter short. Recommendation:
Purchase: no. Need a rollback.
Sale: when a long red daily candle appears.
Support — 1393.0. Resistance — 1739.0.
Sugar 11 white, ICE
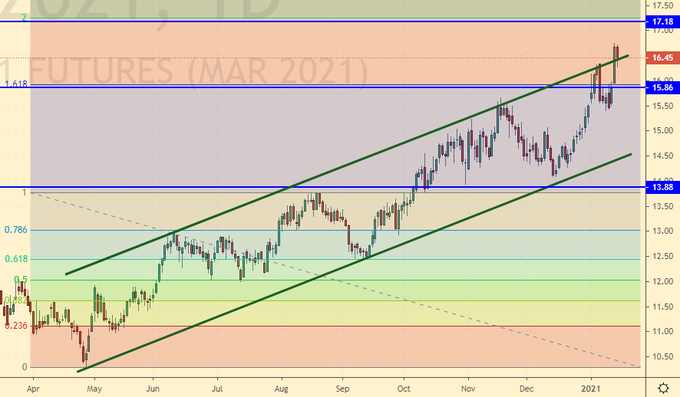
Growth scenario: we continue to expect growth at 17.70. A fight at 17.20 is not excluded. We will not enter new positions.
Falling scenario: given that the commodity market may sink under the onslaught of the dollar, a correction could begin at any time. Therefore, when approaching 17.20 we try to sell, when touching 17.70 we must sell.
Recommendation:
Purchase: no. Need a rollback.
Sale: on touch 17.18. Stop: 17.38. Target: 13.90.
Support — 15.86. Resistance — 17.18.
Сoffee С, ICE
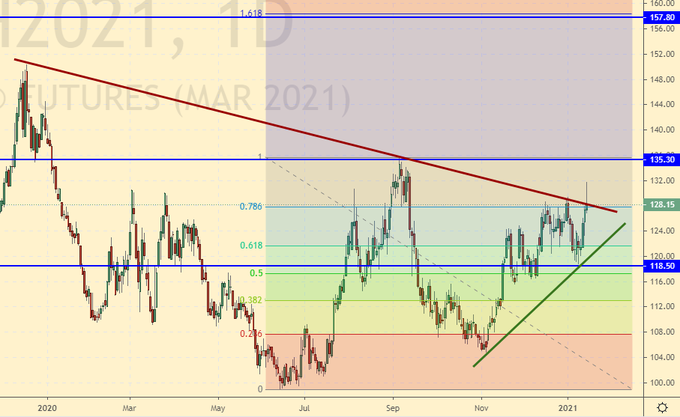
Growth scenario: the market is trying to get out of consolidation upwards. The long shadow of a Friday candle is scary. We do not buy.
Falling scenario: short? If the market falls below 124.00, you can try to sell. The current situation is uncertain.
Recommendation:
Purchase: no.
Sale: after falling below 124.0. Stop: 128.10. Target: 108.60.
Support — 118.50. Resistance — 135.30.
Gold. CME Group
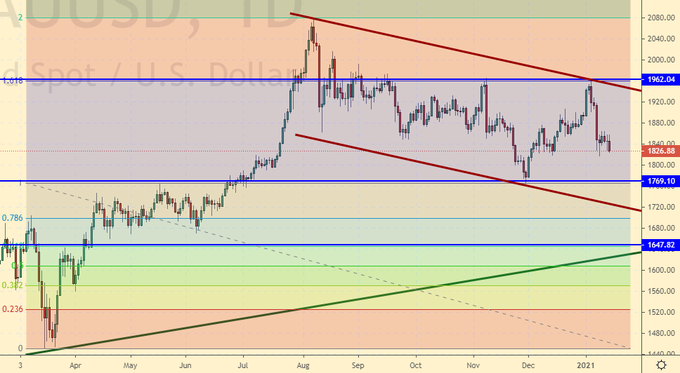
Growth scenario: the market froze, it is extremely tempting to enter long. The stop can be placed just below 1800, which is quite comfortable. If gold chooses its way up amid Biden’s inauguration, the 2260 target will reappear on the horizon.
Falling scenario: yes, we cannot discount the scenario with a strengthening dollar due to the prospect of rate hikes at the end of this year. The traders who sold last week are holding the shorts and are not afraid of anything.
Recommendation:
Purchase: now. Stop: 1812 (1787). Target: 2260. Consider the risks!
Sale: on touch 2260 required. Anyone in the position from 1920, move the stop to 1926. Target: 1660.
Support — 1769. Resistance — 1962.
EUR/USD
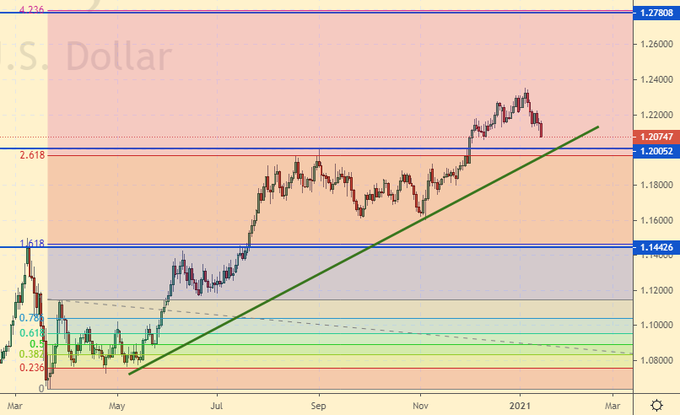
Growth scenario: some struggle can be expected at 1.2000, but the bulls have little chance of keeping the market above the support line. Since the beginning of the year we have already gone down three figures, and this is hardly the end. Level 1.1460 is the target of the ongoing correction.
Falling scenario: if we quickly go below 1.2000, we can add to the shorts opened a week earlier. It is possible that a fast move to 1.1460 awaits us.
Recommendation: Purchase: no. Anyone in the position from 1.2220, keep the stop at 1.2070. Target: 1.2700.
Sale: no. Those who are in the position from 1.2220, move the stop to 1.2210. Target: 1.1460.
Support — 1.2005. Resistance — 1.2780.
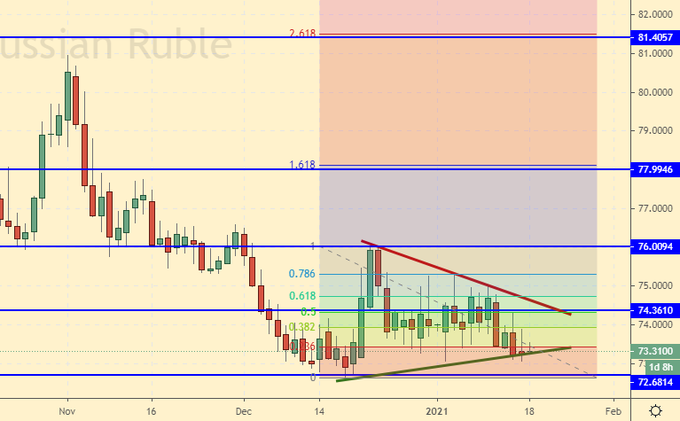
USD/RUB
Growth scenario: against the background of assumptions about the possibility of a rate hike in the US, funds will go out of the debt of developing countries and shift into US debt securities. This will lead to a decrease in interest in Russian debt securities, which will put pressure on the ruble for the foreseeable future. However, the ruble has time to quickly go to 65.00 and quickly return to 75.00. Until the level of 73.00 went down, we bet on the dollar.
Falling scenario: we continue to consider a possible movement to 70.00, and possibly even to 65.00. A stronger strengthening of the ruble is unlikely to be possible. It should be reminded that the Central Bank of the Russian Federation has again switched to the practice of buying foreign currency on the market at 7.1 billion rubles a day.
Purchase: now. Stop: 72.60. Target: 82.00.
Sale: no. Anyone in the position from 74.40, move the stop to 74.60. Target: 65.00.
Support — 72.68. Resistance — 74.36.
RTSI
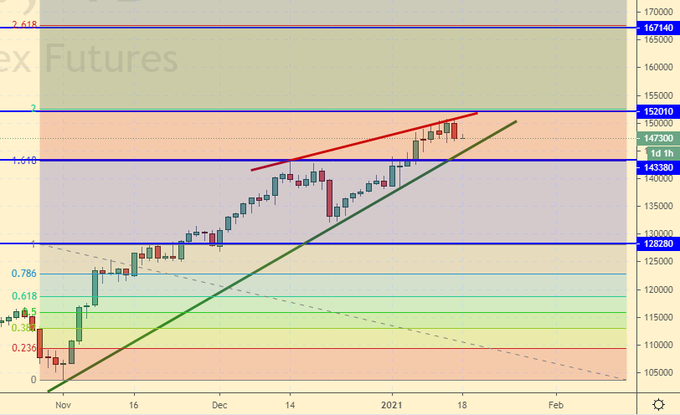
Growth scenario: we were unable to fasten above the level of 150,000. The chances of a pullback increased. Judging by the red candlestick on Friday, at least a pullback to 144000 awaits us. We do not buy.
Falling scenario: the world’s largest corporations are unlikely to be able to show good profits in 2020, which should reduce the attractiveness of shares in the medium term. This will worsen the external background. A rollback to 130,000 according to the RTS index is quite a reasonable development of events at this stage.
Recommendation:
Purchase: no.
Sale: now. Stop: 151,000. Target: 130,000 (100,000).
Support — 143380. Resistance — 152010.
The recommendations in this article are NOT a direct guide for speculators and investors. All ideas and options for working on the markets presented in this material do NOT have 100% probability of execution in the future. The site does not take any responsibility for the results of deals.


