16 May 2022, 13:10
Price forecast from 16 to 20 of May 2022
-
Energy market:
Biden wrote a paper that the country will reduce the budget deficit by 1.5 trillion. dollars per year. Great slogan. At this rate, in 100 years they will completely get rid of debts.
Hello!
There was no miracle in the oil market. Sellers failed to break through in the first ten days of May below the psychological level of 100.00 for Brent oil.
Another OPEC report was released, in which it was written in black and white that the fall in oil production in Russia due to sanctions in April could amount to 930,000 barrels per day, which is 8% of current production. Things are expected to be no better in May. Thus, supply is physically leaving the market, which in no way can contribute to a fall in prices.
In this situation, exporting countries should not even be forced to take the side of Russia. It is enough for them to be on their side and not increase production at the request of the “hungry” West. Super profits in dollars are much better than just profits.
By reading our forecasts, you could make money on the gas oil market by going up from 980.0 to 1080.0 dollars per ton.
Grain market:
On May 12th the USDA report was released. Forecasts for wheat and corn for the 22/23 season are slightly more modest than last year’s record. There will be no hunger. Congratulations!
For wheat, the gross harvest is forecast at 774.8 million tons, which is only 0.5% less than last season’s result.
Wheat production will decline in Ukraine, Australia, Morocco, Argentina, the European Union and China. Feed consumption is expected to decline in Australia, China and the European Union. Food consumption will continue to grow due to population growth. Trade is projected to be record high with increased imports in Africa, Southeast Asia and the Western Hemisphere.
For corn, the gross harvest is forecast at 1180.7 million tons, which is 2.9% less than last season.
Production will be reduced in Ukraine, the USA, China and the EU. At the same time, Argentina and Brazil will receive record volumes. World trade will decrease due to the lack of export supplies from Ukraine. Global consumption for both feed and non-feed purposes is expected to decrease slightly.
You see, there’s nothing to worry about. It will only be necessary to earn money to buy all these millions of tons.
USD/RUB:
For the time being, strict currency regulation remains on the Russian market. In conditions when large consignments of cash are not imported into the country, the gap between the exchange rate and the black market is kept at the level of 13-15 rubles.
It cannot be ruled out that this difference will grow in the coming months, since rapid import substitution will be impossible for a number of positions, and the purchase of a number of positions will require the currency of developed countries.
As long as the inflow of foreign currency into the country is significant, in the current legislative restrictions there is no way to talk about the growth of the dollar against the ruble. The growth of the dollar can be easily suppressed by the regulator. The rise of the pair to the level of 70.00 is possible, a stronger growth is still questionable.
Brent. ICE
We’re looking at the volume of open interest of managers. You should keep in your mind that these are data from three days ago (for Tuesday of the past week), they are also the most recent of those published by the ICE exchange.
Over the past week, the difference between long and short positions of managers increased by 1.9 thousand contracts. Bulls did not increase, but some of the sellers chose to leave the market. Growth scenario: we are considering the May futures, the expiration date is May 31. Insidiously we were knocked out of the long, but do not despair. We buy again. We do not have a single scenario for the fall in oil prices.
Falling scenario: as soon as it becomes clear that there is an excess supply in the market, we will gladly sell. We are not thinking about shorts yet. Recommendation:
Purchase: now. Stop: 104.00. Target: 125.00 (150.00).
Sale: no.
Support — 104.68. Resistance is 114.02.
WTI. CME Group
Fundamental US data: the number of active drilling rigs increased by 6 units and now stands at 563 units.
Commercial oil reserves in the US increased by 8.487 to 424.214 million barrels, while the forecast was -0.457 million barrels. Inventories of gasoline fell -3.607 to 224.968 million barrels. Distillate inventories fell -0.913 to 104.029 million barrels. Inventories at Cushing fell -0.587 to 28.242 million barrels.
Oil production fell by -0.1 to 11.8 million barrels per day. Oil imports fell by -0.063 to 6.269 million bpd. Oil exports fell by -0.695 to 2.879 million barrels per day. Thus, net oil imports increased by 0.632 to 3.39 million barrels per day. Oil refining increased by 1.6 to 90 percent.
Gasoline demand fell by -0.154 to 8.702 million bpd. Gasoline production increased by 0.027 to 9.716 million barrels per day. Gasoline imports fell -0.432 to 0.695 million bpd. Gasoline exports rose by 0.106 to 0.942 million barrels per day.
Demand for distillates fell by -0.179 to 3.777 million barrels. Distillate production increased by 0.163 to 4.882 million barrels. Distillate imports rose by 0.031 to 0.122 million barrels. Distillate exports rose by 0.168 to 1.357 million barrels per day.
Demand for petroleum products fell by -0.236 to 19.231 million barrels. Production of petroleum products increased by 0.579 to 21.501 million barrels. Imports of petroleum products fell by -0.472 to 1.817 million barrels. The export of oil products increased by 0.024 to 5.908 million barrels per day.
Propane demand fell -0.204 to 0.777 million barrels. Propane production increased by 0.053 to 2.369 million barrels. Propane imports fell -0.011 to 0.091 million barrels. Propane exports fell by -0.01 to 1.195 million barrels per day.
We’re looking at the volume of open interest of WTI managers. You should keep in your mind that these are data from three days ago (for Tuesday of the past week), they are also the most recent of those published by the ICE.
Last week, the difference between long and short positions of managers decreased by 2.4 thousand contracts. A small group of sellers appeared, but their arrival, in fact, did not affect the situation in any way. The market remains bullish.
Growth scenario: we are considering the July futures, the expiration date is June 21. Also, as in Brent, we will go into the purchase for the second time after the breakdown of stop orders.
Falling scenario: there are no options with prices falling right now. Let’s get back to talking about shorts after the market fell below 100.00.
Recommendation:
Purchase: now. Stop: 102.00. Target: 150.00.
Sale: no.
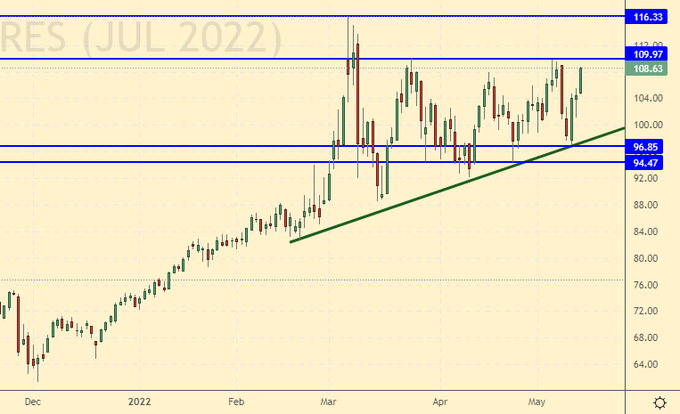
Support — 96.85. Resistance is 109.97.

Gas-Oil. ICE
Growth scenario: we consider the June futures, the expiration date is June 10. We continue to buy. There is a feeling that speculators will arrange a black bath for motorists in the summer season.
Falling scenario: we refuse new shorts, we keep the old ones. Yes, there is a slowdown in growth, and in a calm situation we could turn down, but the political situation is far from normal.
Recommendation:
Purchase: now. Stop: 1060.0. Target: 1500.0!
Sale: no. Who is in position from 1150.0, move the stop to 1180.0. Target: 800.0.
Support — 1032.00. Resistance is 1224.00.
Natural Gas. CME Group
Growth scenario: we are considering the June futures, the expiration date is May 26. We will refrain from shopping for now. In the US, there is an increase in oil and gas production, and this will cool the market. Terminals for gas liquefaction cannot yet digest all the proposals available on the market.
Falling scenario: we continue to believe that it would be interesting to enter short from 10.200. Selling from current levels is also possible. Recommendation:
Purchase: no.
Sale: when approaching 10.200. Stop: 11.200. Target: 7.500. Or now. Stop: 8.200. Target: 5.600.
Support — 7.233. Resistance — 8.204.
Wheat No. 2 Soft Red. CME Group
We’re looking at the volume of open interest of wheat managers. You should keep in your mind that these are data from three days ago (for Tuesday of the past week), they are also the most recent of those published by the CME Group.
Over the past week, the difference between long and short positions of managers increased by 5.2 thousand contracts. There are more buyers on the market, and in fact, so far they have turned out to be right. The market is growing.
Growth scenario: we consider the July futures, the expiration date is July 14. Confused by the inability of corn to continue growing. We will keep previously open longs, we do not open new deals.
Falling scenario: in terms of wave structure, a good place for a short. Can be sold. The USDA report was generally positive, it could cool the market by 10%.
Recommendation:
Purchase: no. Who is in position from 1060.0, move the stop to 1063.0. Target: 1400.0.
Sale: now. Stop: 1230.0. Target: 900.0.
Support — 1144.0. Resistance — 1275.6.
We’re looking at the volume of open interest of corn managers. You should keep in your mind that these are data from three days ago (for Tuesday of the past week), they are also the most recent of those published by the CME Group.
Last week the difference between long and short positions of managers decreased by 14.4 thousand contracts. A group of sellers entered the market, which, it is possible, will continue to put pressure on money in order for their bet to fall to work.
Growth scenario: we consider the July futures, the expiration date is July 14. A fall towards 700.0 after the release of the USDA report cannot be ruled out. We don’t buy.
Falling scenario: shorts from current levels are possible. We do not expect a strong fall, but a correction is visible.
Recommendation:
Purchase: no.
Sale: now. Stop: 816.0. Target: 700.0. Who is in position from 810.0, move the stop to 816.0. Target: 700.0 (600.0!).
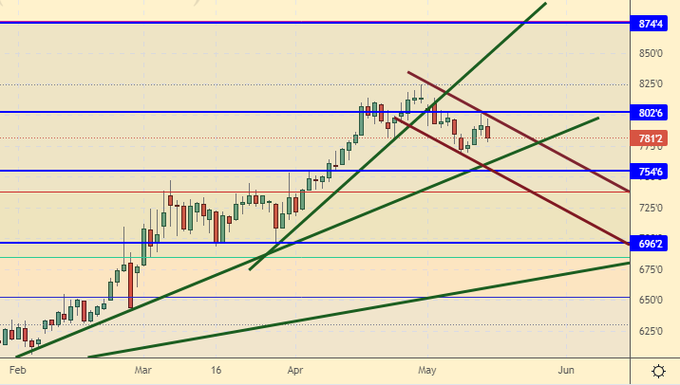
Support — 754.6. Resistance — 802.6.
Soybeans No. 1. CME Group
Growth scenario: we consider the July futures, the expiration date is July 14. Despite the fact that we have not reached 1800, we will leave attempts to buy for now. USDA forecast for soybeans for this year +12.97%. It’s a lot.
Falling scenario: A great place to go short. We hold old shorts and open new ones.
Recommendation:
Purchase: no.
Sale: now. Stop: 1680.0. Target: 1350.0. Who is in position from 1690.0, move the stop to 1680.0. Target: 1350.0.
Support — 1558.6. Resistance — 1657.2.
Sugar 11 white, ICE
Growth scenario: we are considering the July futures, the expiration date is June 30. We see the desire to buy. Let’s join. Especially since our target at 21.60 remains in place.
Falling scenario: we continue to believe that shorts from 21.60 are possible. Selling from current levels looks premature.
Recommendation:
Purchase: now. Stop: 18.40. Target: 21.60.
Sale: when approaching 21.60. Stop: 22.27. Target: 19.00.
Support — 18.09. Resistance is 20.50.
Сoffee С, ICE
Growth scenario: we are considering the July futures, the expiration date is July 19. There are doubts that we will be able to make a new low after Wednesday’s long green candle. Let’s buy here.
Falling scenario: continue to hold shorts. Target at 185.00 remains. But, we admit that the chances of this short to make a profit are extremely small.
Recommendation:
Purchase: now. Stop: 207.00. Target: 250.00.
Sale: no. Who is in positions between 228.00 and 220.0, keep the stop at 226.00. Target: 185.00 (150.00).
Support — 209.80. Resistance is 223.65.
Gold. CME Group
Growth scenario: the dollar continues to put pressure. We go to 1740. When approaching this level, you can open a long position.
Falling scenario: bears continue to push. We have nothing but 1740 downstairs. Keep shorts.
Recommendations:
Purchase: when approaching 1740. Stop: 1720. Target: 2300!
Sale: no. If you are still in position from 1930, move your stop to 1860. Target: 1740.
Support — 1780. Resistance — 1831.
EUR/USD
Growth scenario: not a bad situation to buy. Most likely, before the ECB meeting in early June, the market will not dare to fall further.
Falling scenario: we will sell when we return to the area of 1.1000, not lower.
Recommendations:
Purchase: now. Stop: 1.0320. Target: 1.1000.
Sale: no.
Support — 1.0354. Resistance is 1.0640.
USD/RUB
Growth scenario: if the pair rises above 65.00, you can buy. The chances of growth are not great yet, but macroeconomics will sooner or later win the current artificial trades. Recall that at the moment access for foreign traders to the Russian market is closed.
Falling scenario: further strengthening of the ruble will have a negative impact on the budget. We refrain from selling.
Recommendations:
Purchase: after rising above 65.00. Stop: 64.30. Target: 100.00!
Sale: no.
Support — 60.09. Resistance is 70.84.
RTSI
Growth scenario: the index is supported only by the strengthening of the ruble. There is no positive on the Russian stock market and there is nowhere for it to come from. We don’t buy.
Falling scenario: we continue to believe that shorts from 130,000 will be ideal in this situation. Selling from current levels is also possible. The results for the second quarter, if we know them, of course, will be bad, but for the third … for the third they will be such that we won’t be able to pick up printed words even in a day.
At the moment, according to the results of the year, the fall in Russia’s GDP is projected at the level of 6%, inflation is 22%. It is unlikely that we will demonstrate the growth of the stock market on such expectations.
Recommendations:
Purchase: no. Close all positions.
Sale: when approaching 130000. Stop: 136000. Target: 80000 (50000). Or now. Stop: 121000. Target: 80000 (50000).
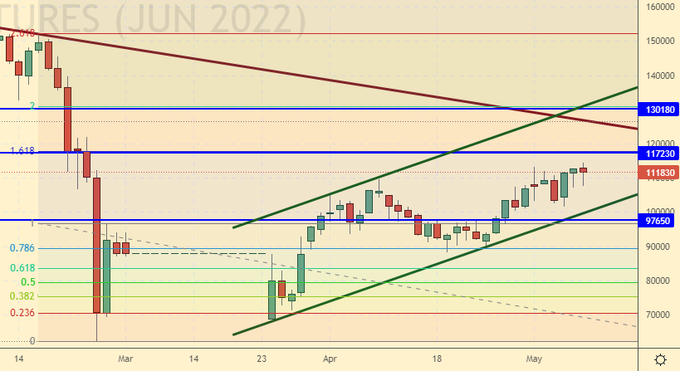
Support — 97650. Resistance — 117230.

The recommendations in this article are NOT a direct guide for speculators and investors. All ideas and options for working on the markets presented in this material do NOT have 100% probability of execution in the future. The site does not take any responsibility for the results of deals.


