Price forecast from 15 to 19 of February 2021
-
Energy market:
Oil continues to break local records despite lower demand expectations this year. So, in July last year, OPEC estimated the demand for oil in December 2021 at 99.71 million barrels per day, the estimate of consumption for December was reduced to 97.94 million barrels per day in the February report of this year. We see these figures in the report of an organization that is clearly interested in the constant growth of demand.
We can assume that real demand for oil will be another couple of million barrels lower by the end of the year than OPEC suggests. That is, 96 million barrels per day by December will be quite a good result. Current consumption is estimated at 93 million barrels per day.
Should we expect a quick downward reversal in the market? More likely yes than no, however, under the circumstances, we are able to pass by 65.00. Note that the objective reality, which a month ago was in the range of 40.00 – 60.00 dollars per barrel for Brent, has shifted upward, to the range of 50.00 — 70.00 dollars per barrel. In the long term, two factors can hit oil hard: a drop in the global stock market or poor reports on economic recovery in the first quarter of 2021.
Grain market:
Cereals do not grow, indicating a desire to cool down by 5-10%. Wheat importers, through tenders, made it clear to grain traders that prices above $ 300 per ton are unacceptable. The exchange market caught this message and stopped.
However, analysts in the US are calling for the sowing of every vacant piece of land, predicting increased demand for wheat this season. It is possible that after a rollback from current highs to May, we will observe a picture uncharacteristic for summer, when grain prices will not fall at all against the background of a new harvest.
The situation can be very dramatic for the poor in society. What is happening fits well with the theory that it is the poor, whose income is mostly spent on food, who will pay for the games of central bank governors with their endless injections of trillions into a barely living body affected by deflation and stagnant circulation of money in the system. The swing in grain prices against the backdrop of a downturn in the economy, and against the background of an extremely high harvest, looks from the outside as a very unfavorable thing, capable of increasing social tension in the future.
USD/RUB:
The Bank of Russia left the rate at 4.25% per annum. Inflation in December and January amounted to 4.9% and 5.2%, respectively, which does not allow the regulator to speculate about a possible rate cut in the future. According to current forecasts, inflation in Russia by the end of the year will be from 3.7 to 4.2%.
The bank noted in its report that the rise in prices was partly due to the rise in dollar prices in world markets. This remark can be interpreted as a long-term acceptance of the fact that the ruble is strengthening by 5-10% in order to somewhat curb the rise in prices for imported goods.
In general, speculators liked this decision of the bank, especially against the background of growing oil, which led to a sharp strengthening of the national currency on Friday. If we see the continued growth of the ruble against the dollar on Monday, this will signal a move to 70.00.
Brent. ICE
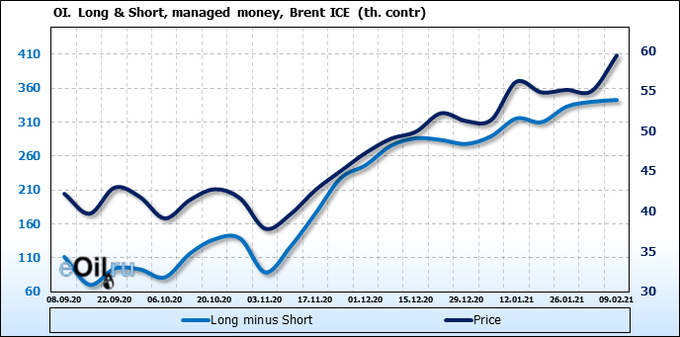
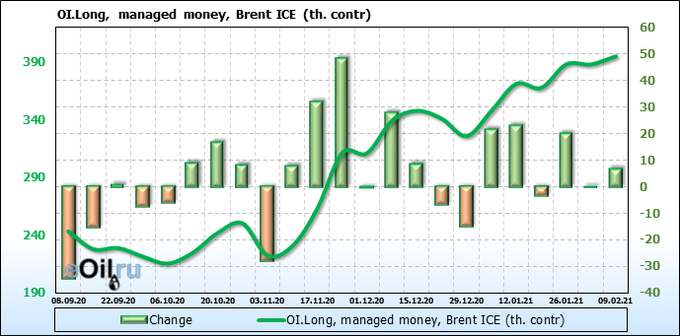
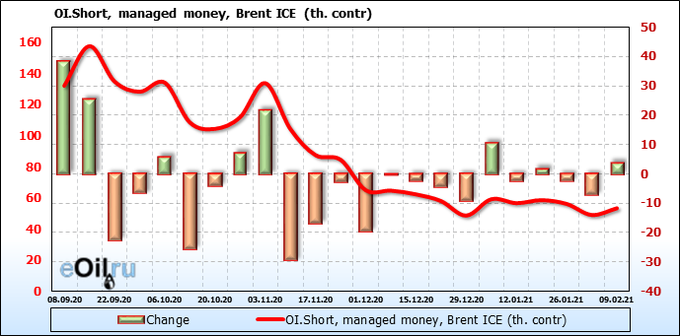
We’re looking at the volume of open interest of managers. You should keep in your mind that these are data from three days ago (for Tuesday of the past week), they are also the most recent of those published by the ICE exchange.
The rise in prices looks much more aggressive than changes in the volumes poured into the market by buyers, which suggests an unjustified rise in prices. Let’s note the appearance of sellers on the market. So far, attempts to gain a foothold in shorts look uncertain, but these attempts are understandable, since the market is overbought.
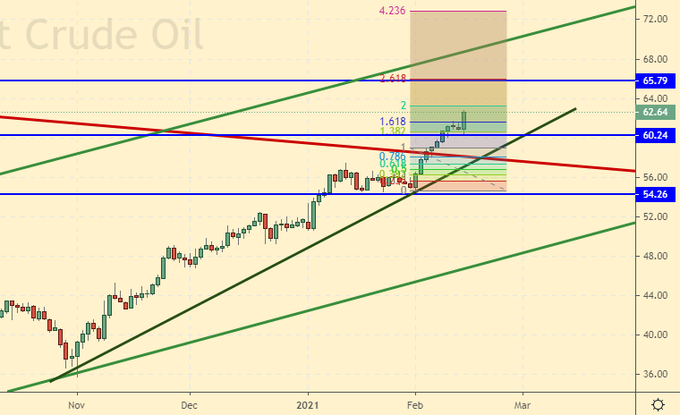
Growth scenario: February futures, expiration date February 26. To enter the market, we need a pullback. Chasing prices is not our style. We are out of the market.
Falling scenario: a fight is possible around 63.00 with a pullback to 60.00, but this scenario is better to work out on hourly intervals. Within the movement from 36.00, we are able to fly to 65.80. Therefore, we are thinking about shorts as prices approach the 66.00 area. If “unexpectedly” Monday closes below 61.00 — sell.
Recommendation:
Purchase: no.
Sale: when approaching the area 66.00. Stop: 67.30. Target: 58.00. If Monday closes below 61.00. Stop: 62.30. Target: 52.20.
Support — 60.24. Resistance — 65.79.
WTI. CME Group
Fundamental US data: the number of active drilling rigs increased by 7 units to 306 units.
US commercial oil reserves fell by -6.645 to 469.014 million barrels. Gasoline inventories rose by 4.259 to 256.412 million barrels. Distillate stocks fell -1.732 to 161.106 million barrels. Cushing’s stocks fell -0.658 to 48.044 million barrels.
Oil production increased by 0.1 to 11 million barrels per day. Oil imports fell by -0.65 to 5.857 million barrels per day. Oil exports fell by -0.866 to 2.617 million barrels per day. Thus, net oil imports rose by 0.216 to 3.24 million barrels per day. Oil refining increased by 0.7 to 83 percent.
Gasoline demand rose 0.087 to 7.857 million barrels per day. Gasoline production rose 0.236 to 8.656 million barrels per day. Gasoline imports rose 0.089 to 0.657 million barrels per day. Gasoline exports fell by -0.043 to 0.737 million barrels per day. Distillate demand rose 0.11 to 4.308 million barrels. Distillate production rose 0.038 to 4.66 million barrels. Distillate imports fell by -0.162 to 0.356 million barrels. Distillate exports rose 0.013 to 0.956 million barrels per day.
The demand for oil products increased by 1.655 to 20.183 million barrels. The production of petroleum products increased by 0.395 to 20.226194 million barrels. Imports of petroleum products fell by -0.279 to 2.172 million barrels. Exports of petroleum products fell by -0.563 to 4.856 million barrels per day.
Propane demand rose 0.714 to 2.204 million barrels. Propane production fell by -0.038 to 2.37 million barrels. Propane imports rose by 0.134 to 0.288 million barrels. Propane exports fell by -0.197 to 1.098 million barrels per day.
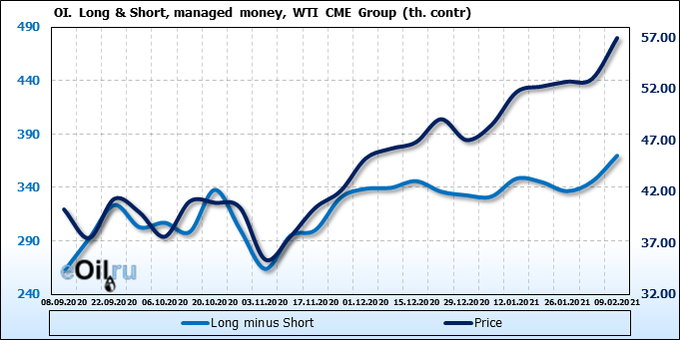
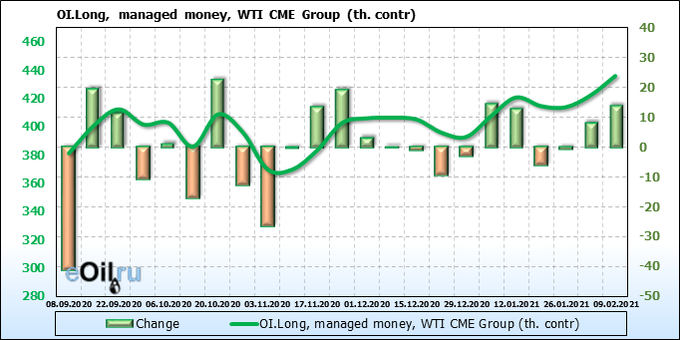
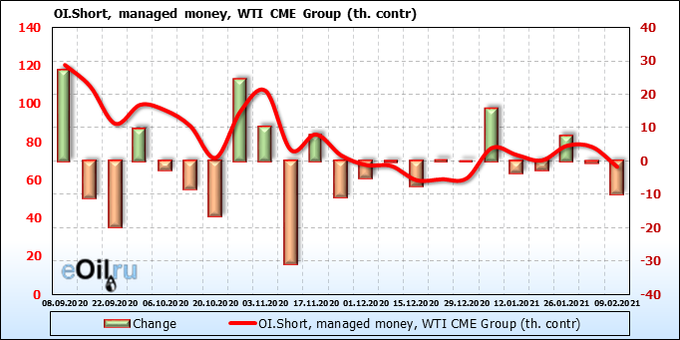
We’re looking at the volume of open interest of managers. You should keep in your mind that these are data from three days ago (for Tuesday of the past week), they are also the most recent of those published by the CME exchange.
The bulls continue to build up pressure. There are no sellers. The rise in prices for WTI looks more reasonable than for Brent. There are no sellers. There is no point in thinking about sales under these circumstances.
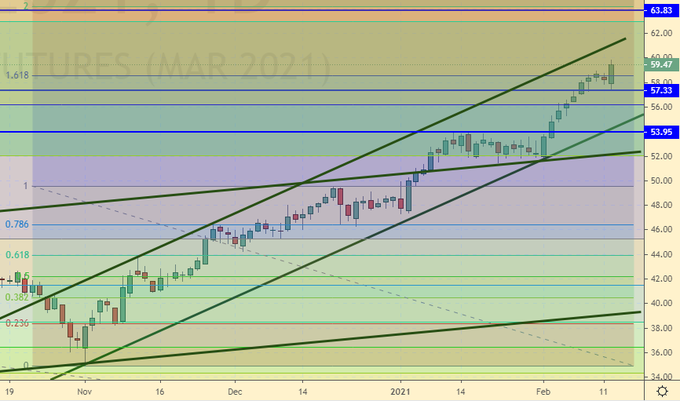
Growth scenario: March futures, expiration date February 22. We continue to wait for a rollback. We do not enter purchases from current levels. We are looking for trading opportunities in other markets.
Falling scenario: the Friday candlestick looks extremely aggressive. There are no hints of a reversal yet. There is a small chance that this outlier, with the collection of stop orders from few sellers, was a trap. We will understand this if Monday closes below 58.00.
Recommendation:
Purchase: no.
Sale: if Monday closes below 58.00. Stop: 59.30. Target: 50.20.
Support — 57.33. Resistance — 63.83.
Gas-Oil. ICE
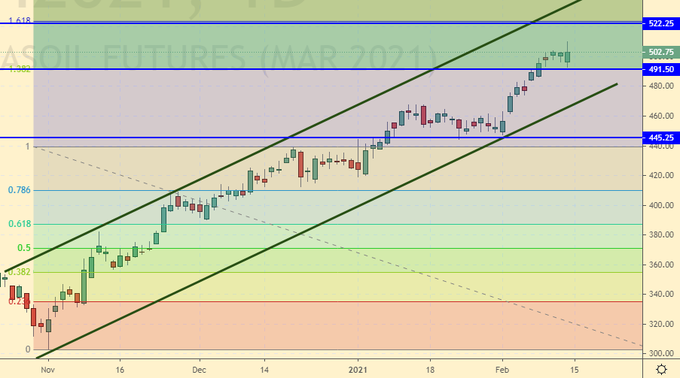
Growth scenario: March futures, expiration date March 11th. There are no interesting shopping levels. We are out of the market.
Falling scenario: last week’s sales did not come to anything. We are on the sidelines. We are waiting for a reversal.
Recommendation:
Purchase: no.
Sale: no.
Support — 491.50. Resistance — 522.25.
Natural Gas. CME Group
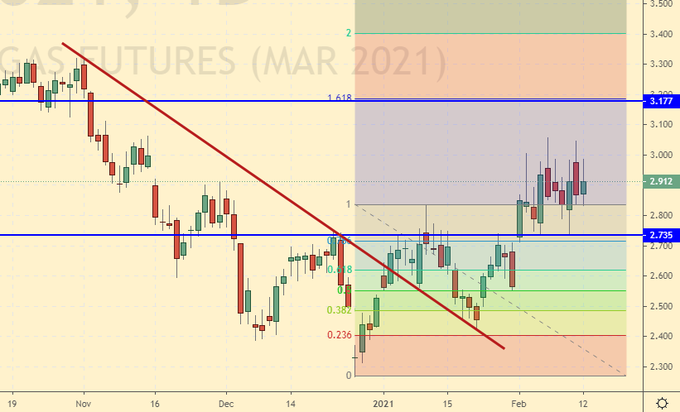
Growth scenario: March futures, expiration date February 24. The cold winter continues to support gas prices. We expect the growth to continue. Against the background of the prospect of completion of construction of the highly politicized project «Nord Stream-2», the upward movement will be limited, but still, by 3.15 we are able to come.
Falling scenario: the market found resistance around 3.00. if we were around 5.00, then such a picture could provoke us to short, and we will not sell at the current levels.
Recommendation:
Purchase: no. Anyone in the position from 2.550, keep the stop at 2.630. Target: 3.150.
Sale: no.
Support — 2.735. Resistance — 3.177.
Wheat No. 2 Soft Red. CME Group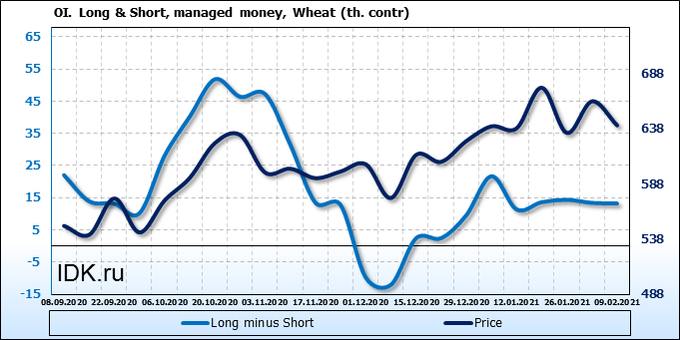
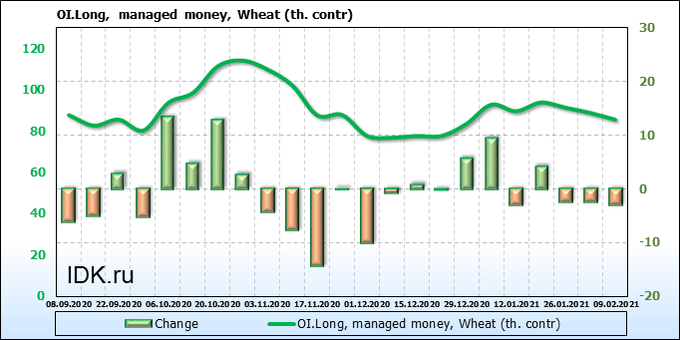
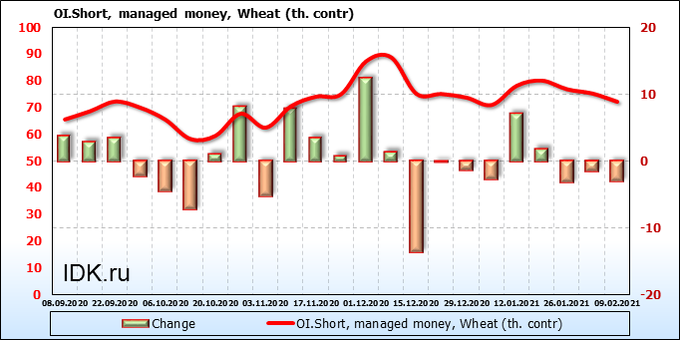
We’re looking at the volume of open interest of managers. You should keep in your mind that these are data from three days ago (for Tuesday of the past week), they are also the most recent of those published by the CME exchange.
Both sellers and buyers continue to leave the market for three weeks. Most likely, trading participants rely on seasonality, when on the horizon from February to April new trends do not appear on the market and all trading is in a wide range.
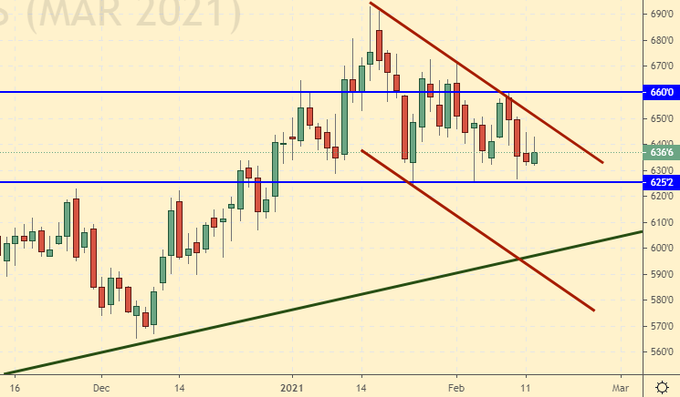
Growth scenario: March futures, expiration date March 12. The market very eloquently shows us that it is ready to continue to decline within the falling channel formed by it. We are not buying yet. Falling scenario: we continue to stand in shorts counting on a fall to 560.0. In this situation, you do not need to do anything other than moving stop orders along the trend. However, those wishing to add to open positions can do this when the level 610.0 is broken down.
Recommendation:
Purchase: no.
Sale: no. Anyone in the position, from 665.0, move the stop to 663.0. Target: 560.0.
Support — 625.2. Resistance — 660.0.
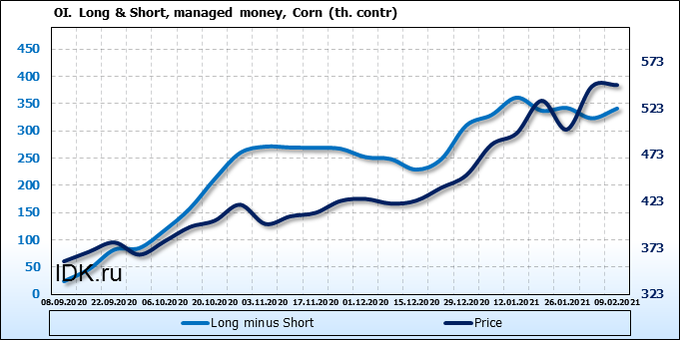
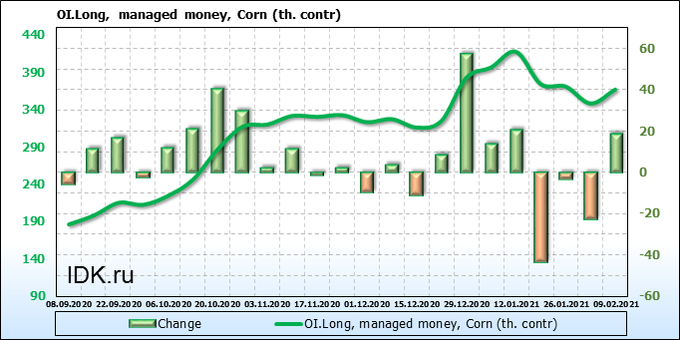
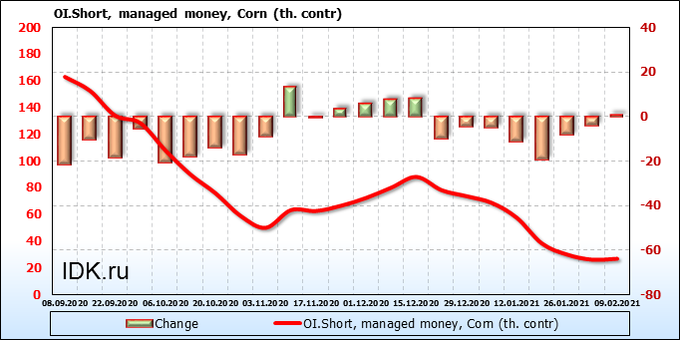
We’re looking at the volume of open interest of managers. You should keep in your mind that these are data from three days ago (for Tuesday of the past week), they are also the most recent of those published by the CME exchange.
The market completed an upward impulse. It is almost impossible to push it further without a corrective move. Therefore, we do not pay attention to the surge from buyers. Moreover, in fact, at the end of Friday we see that purchases for 20 thousand contracts did not lead the bulls to success.
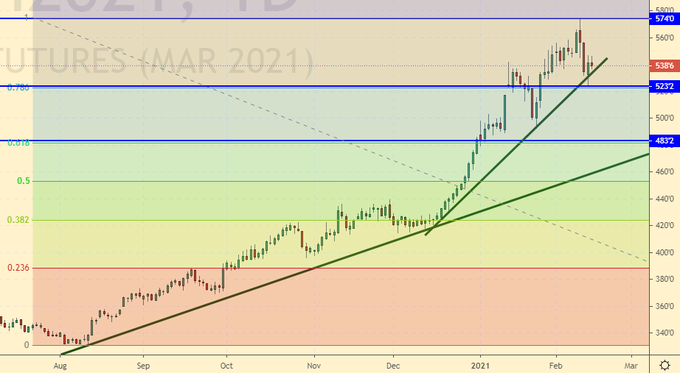
Growth scenario: March futures, expiration date is March 12. We are waiting for the correction. The current levels are high. The market has so far only indicated a way out of overbought conditions. In the future, a rollback to 420.0 is real.
Falling scenario: «it cannot be ruled out that the «puppeteers» will try to push the market to 580.0, we must be ready for this,” we wrote a week earlier. And so it happened. We went above the theoretical level by 10 cents. There was not enough gunpowder for more. It is not clear yet whether there will be another upward approach, therefore, we will leave the stop order at 590.0.
Recommendation:
Purchase: no. Need a rollback.
Sale: when approaching 560.0 and up to 580.0. Stop: 590.0. Target: 420.0. Whoever is in position from 570.0, keep the stop at 590.0. Target: 420.0.
Support — 523.2. Resistance — 574.0.
Soybeans No. 1. CME Group
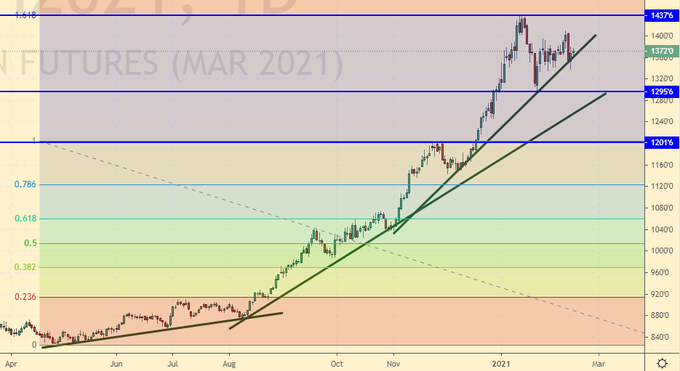
Growth scenario: March futures, expiration date March 12. We are waiting for a rollback to the area 1200.0 — 1250.0. The market is overheated. We do not buy.
Falling scenario: we recommend selling again. You can aggressively. It is unlikely that we will see an attempt to pass above 1450.0, without a rollback. Recommendation:
Purchase: no. We need to rollback to 1200.0 — 1250.0.
Sale: now. Stop: 1416.0. Target: 1200.0.
Support — 1295.6. Resistance — 1437.6.
Sugar 11 white, ICE
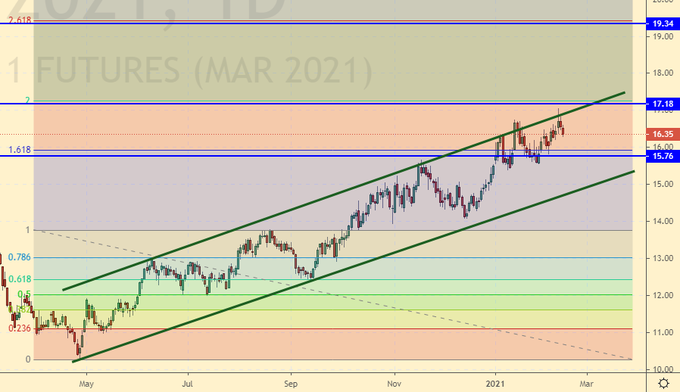
Growth scenario: March futures, expiration date February 26. We do not deny the possibility of a passage at 19.34, but before that we would like to see a fall to the lower border of the channel at 15.30.
Falling scenario: sell here. Unfortunately, the market went up to 17.18 and knocked down stop orders, we wrote about this possibility. Nevertheless, the favorable situation remains for the short.
Recommendation:
Purchase: no. We need a rollback to 15.30. The target for 19.30 is relevant in the medium term. Sale: now. Stop: 17.38. Target: 15.30.
Support — 15.76. Resistance — 17.18.
Сoffee С, ICE
Growth scenario: March futures, expiration date March 19. We’re going down and that’s good. We do not expect a global downward reversal. We need a passage to 115.0 for a comfortable entrance to the long.
Falling scenario: we will keep the previously opened shorts. There is not much sense to add here. If we go down to 110.0, this would be a good trend in the current circumstances.
Recommendation:
Purchase: no. We need a rollback to 115.0, or better to 110.0.
Sale: no. Whoever is in positions from 124.00, 123.80, 122.60 and 125.00, keep the stop at 128.10. Target: 110.30.
Support — 118.50. Resistance — 126.95.
Gold. CME Group
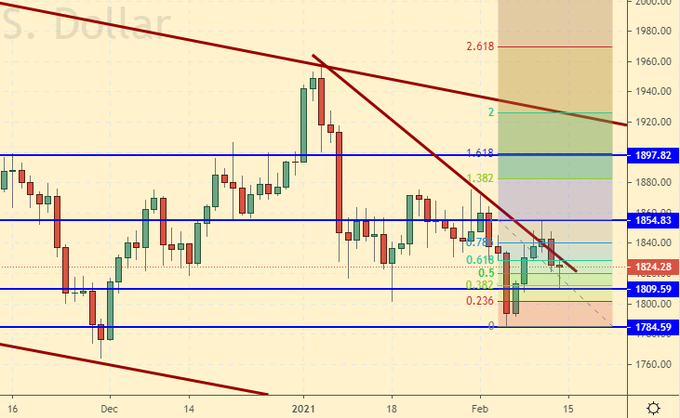
Growth scenario: The market is at a crossroads. Most do not yet have an understanding of the prospects for the strength or weakness of the dollar. Therefore, we see the swing from side to side. The market has already estimated the injection of 1.9 trillion dollars to the US economy. If the expansion of this program does not follow, then the dollar has a chance of strengthening. GDP growth will be important here. If it appears, traders will forgive the Fed for everything, absolutely everything. You can buy here.
Falling scenario: Whoever sold five weeks ago is holding shorts. We do not open new positions down.
Recommendations:
Purchase: now. Stop: 1807. Target: 2260 (5000 ?!). Who is in position from 1810, move the stop to 1807. Target: 2260 (5000 ?!)
Sale: no. Who is in the position from 1920, move the stop to 1863. Target: 1660 ?!
Support — 1809. Resistance — 1854.
EUR/USD
Growth scenario: we don’t want to fall. The rebound from 1.1950 looks very confident. Let’s buy. It is possible that in conditions of uncertainty, since it is not clear how much the assistance of the US authorities helps the economy, the market will prefer to go to 1.2760.
Falling scenario: still holding the shorts. The situation is not very good, to be honest. There is no need to increase aggression. We stand with what was opened earlier.
Recommendation:
Purchase: now. Stop: 1.1980. Target: 1.2760.
Sale: no. Whoever is in the position from 1.2220, keep the stop at 1.2210. Target: 1.1460.
Support — 1.1951. Resistance — 1.2358.
USD/RUB
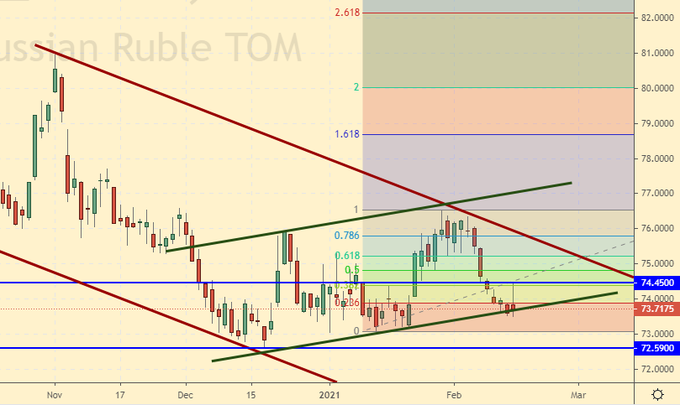
Growth scenario: the market punished dollar fans severely on Friday. As a result, global market uncertainty has only grown. The current situation is such that in case of a breakdown below 73.00, we will finish forming a correction to the previous fall, which in the future will lead to a move to the 70.00 area. Clarity is needed. We do not buy.
Falling scenario: it is a pity that we did not rise to 75.00. If this happened, then against the background of growing oil it would be possible to sell quietly. Events last week developed a little more nervously than we expected. Those interested can sell if the level 73.00 is broken down. But the deal will have a low reward / risk ratio, so we will not recommend it explicitly.
Purchase: no.
Sale: no.
Support — 72.59. Resistance — 74.45.
RTSI
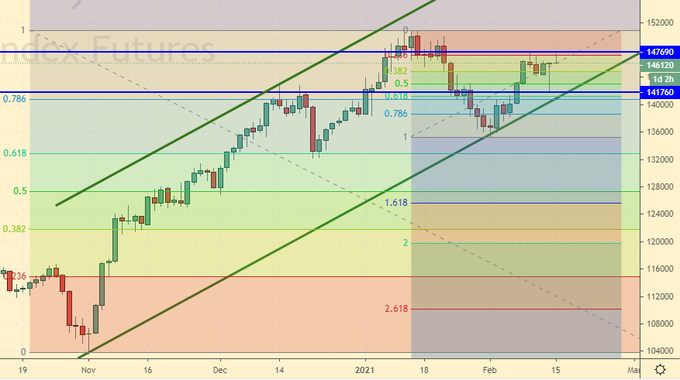
Growth scenario: March futures, expiration date March 18. The ruble that strengthened on Friday helped the index return to 147,700. We have not yet reached a new high, but if the market rises above 149,000, it makes sense to think about buying. However, reduce your capital risk by two or three times. Obviously, we will not recommend buying on a breakout at maximum prices, although we recognize the possibility of growth to 160,000.
Falling scenario: what we saw on Friday evening on the ruble and on oil is a big question. Since the oil market is overbought, large players could paint a terrible picture for us, involving new participants in purchases. Based on the fact that the growth in the oil market and the strengthening of the ruble could be a bluff, we recommend selling if the market falls below 144,900.
Recommendation:
Purchase: no.
Sale: if it falls below 144900. Stop: 148100. Target: 130000 (100000). Anyone in the position from 147000, move the stop to 148100. Target: 130,000 (100000). Consider the risks!
Support — 141760. Resistance — 147690.
The recommendations in this article are NOT a direct guide for speculators and investors. All ideas and options for working on the markets presented in this material do NOT have 100% probability of execution in the future. The site does not take any responsibility for the results of deals.

